INVESTMENT ENVIRONMENT1
Source: Orion Advisor Services, AlphaGlider
Global equity markets’ strong momentum continued into the fourth quarter of 2025, up 3.2% as measured by the MSCI ACWI IMI Index.^d Foreign markets led the way with developed markets (MSCI EAFEb) up 4.9% and emerging markets (MSCI Emerging Markets Indexc) up 4.7%. The US market (S&P 500a) lagged, but was still up a respectable 2.6%. Fixed income markets were solid—our fixed income benchmark, the Bloomberg US Aggregate Index,e was up 1.1% during the quarter.
2025 was the best year for global equity markets since 2019, up 22.1%. Emerging markets’ 33.6% return was the highest among the globe’s equity market regions, narrowly beating out foreign developed markets which were up 31.2%. 2025 was the first year in 15 that US equities lagged behind those in Asia, Europe, and emerging markets indexes, increasing “only” 17.4%. It was also a good year for fixed income which returned 7.3%.
With the US government shutdown over, data on the economy has recently resumed. December’s core consumer price index (CPI) was up 2.6% over year ago levels, flat on November’s increase and still well above the Federal Reserve’s 2% target.
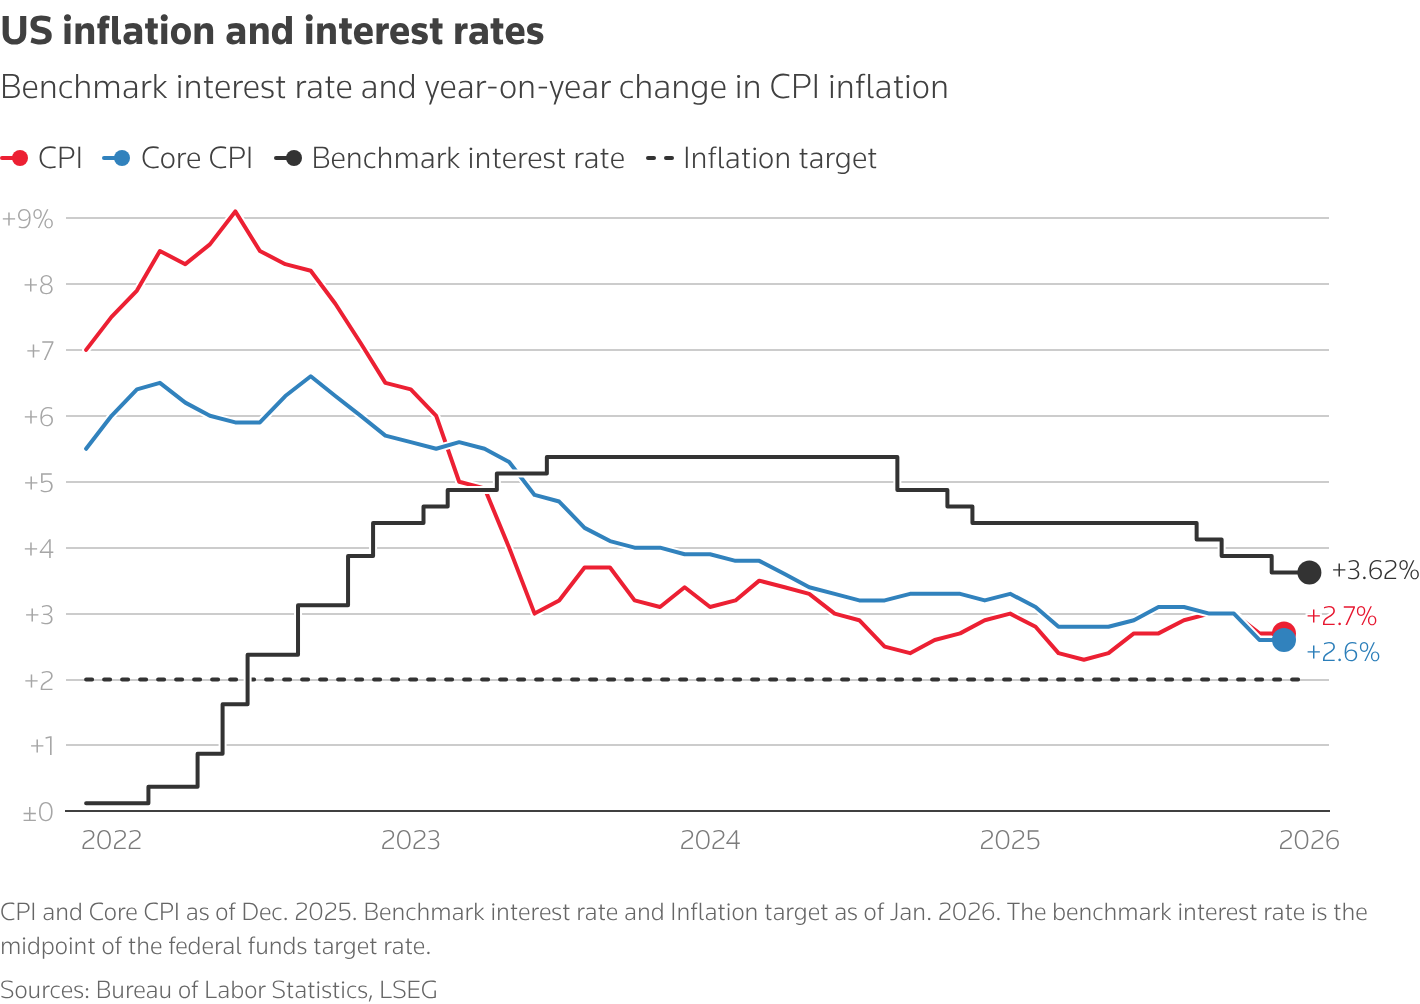
Source: Reuters
Inflation is lower than many feared when President Trump announced his “reciprocal tariffs” back in April, taking the average statutory tariff rate based on 2024 imports from low single digits to well over 30% (see chart below).
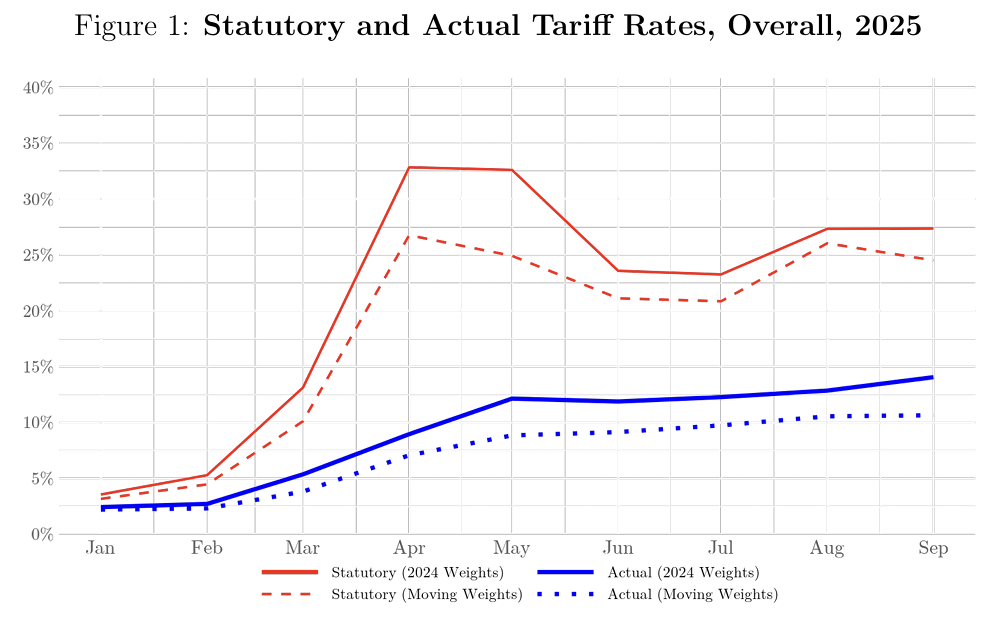
Source: Gita Gopinath & Brent Neiman
There are many reasons for lower than expected tariff collections—actual tariffs remain below as indicated by the the blue line on the chart. Lower than expected tariffs equate directly to lower than expected inflation on imported goods. Reasons for the lower than expected tariffs include:
- Accelerated inventory build ahead of tariff announcements
- Goods in transit when tariffs went into effect were exempted from the tariffs
- Sourcing changes between 2024 and 2025 (e.g. sourcing moved from higher tariffed countries to lower tariffed countries; this is the difference between the solid and dashed lines in the chart above)
- Subsequent pauses and exemptions issued by the Trump administration (e.g. semiconductors and other electronics)
- Increased compliance with the U.S.-Mexico-Canada (USMCA) trade agreement which largely avoids the tariffs
- Various legal and illegal strategies used by companies to lower tariff rates (e.g. false information on customs forms; re-routing of shipments)
The US’s “low hire, low fire” labor market continued into the fourth quarter. Layoffs hit a 17 month low in December, but net job creation was weak at only 50,000. The unemployment rate stood at 4.4%, flat on September’s level. Perceptions of job availability were the worst in at least 12.5 years , according to a monthly survey from the Federal Reserve Bank of New York. Consumer spending and outlooks continued on their K-shaped path, with higher-income Americans (i.e. those exposed to the strong stock market) doing well and lower-income Americans scrambling to make ends meet.
Moving overseas, there are two Organization of the Petroleum Exporting Countries (OPEC) nations in turmoil which could possibly impact energy prices in the near and long term, Venezuela and Iran. First, Venezuela. Motivated to control the country’s substantial oil reserves, President Trump captured Venezuelan president Nicolás Maduro and his wife Cilia Flores in their Caracas residence on 3 January, and brought them to the US to face drug trafficking charges. The rest of the Venezuelan government remains intact and in control, but appears to be cooperating with Trump’s demands—most of which revolve around the country’s oil industry. Trump has told Venezuela’s interim president Delcy Rodríguez to sever economic ties with China, Russia, Iran, and Cuba, and to partner exclusively with the US on oil production and sales. In the near term, 30 to 50 million barrels of Venezuelan oil would be “given” to the US to sell at market prices, with the proceeds used “to benefit the people of Venezuela and the United States.” Although the US military does not have boots on the ground to enforce Trump’s demands, it has threatened more seizures of oil tankers not approved by the US, as well more attacks and abductions of Venezuelan government officials who resist Trump’s demands.
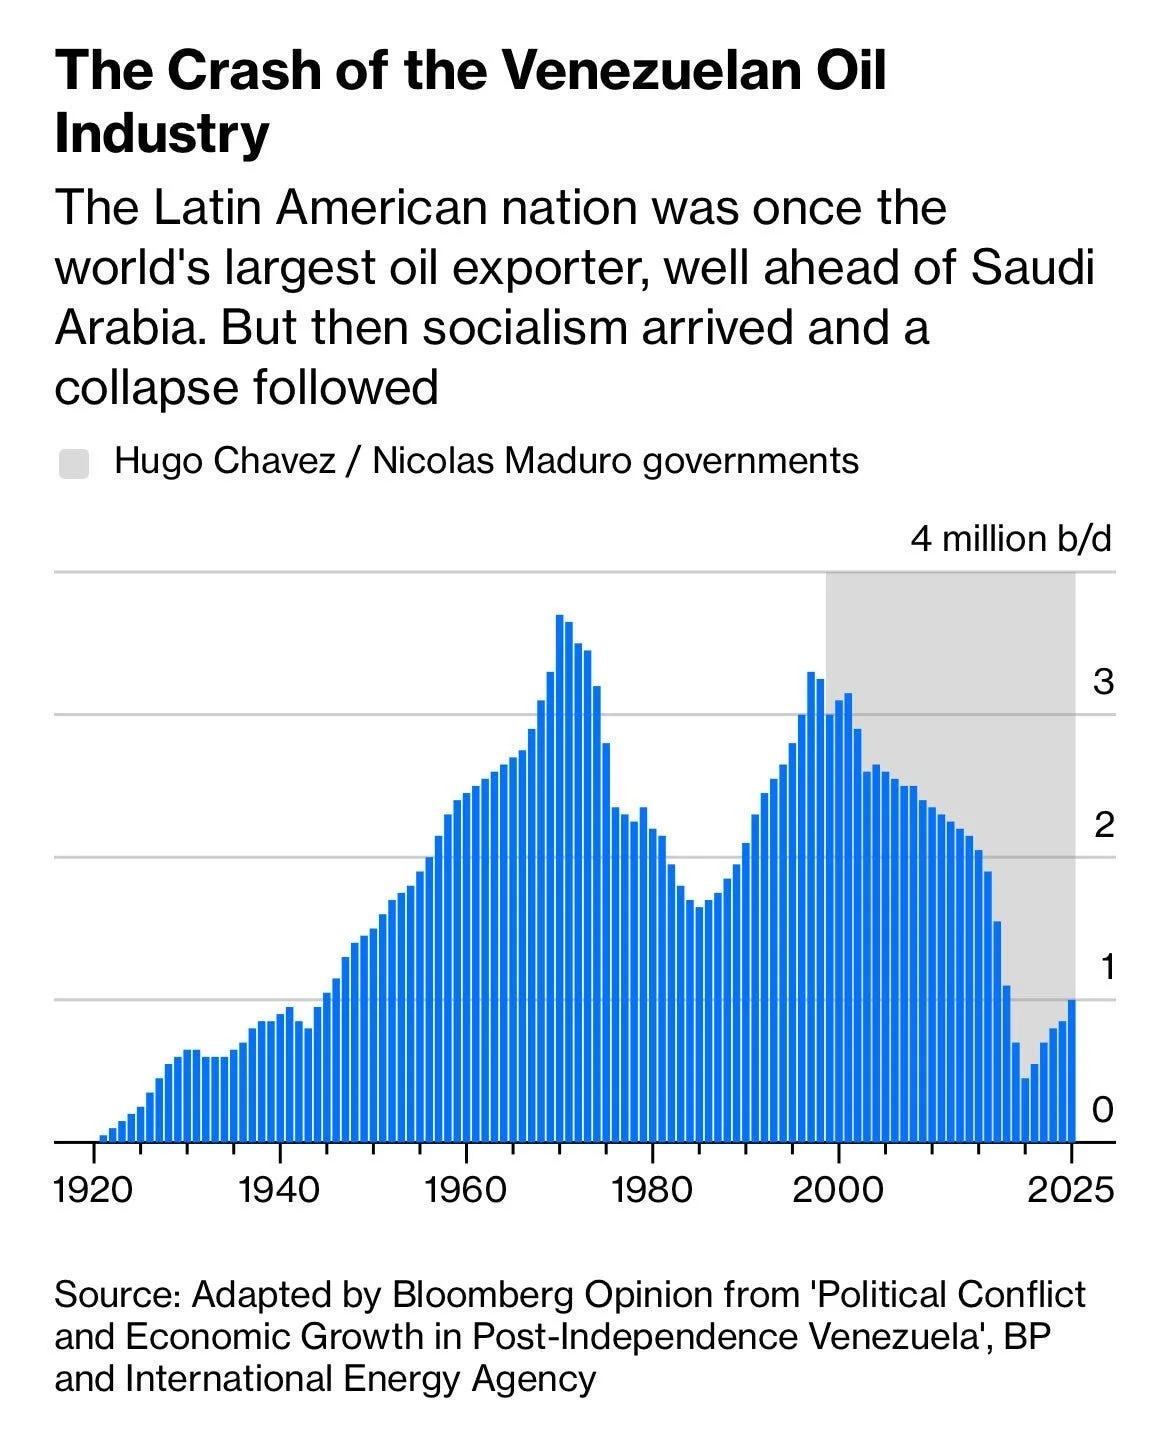
Source: Bloomberg
Venezuela used to be a major oil exporter exiting the 1990s, but serious mismanagement and corruption by the socialist regimes of Chavez and Maduro reduced the country’s oil exports to a trickle, as shown in the chart to the right. After 25 years of neglect, oil analysts estimate that it will take over $100 billion of investment over the coming 10-15 years to meaningfully increase production. Having some of the heaviest, most sour crude in the world, there are few refineries that can process Venezuelan crude. When Venezuelan oil exports collapsed, these complex refineries either shifted to processing heavy crude from from other sources like Canada, Mexico, and the Middle East, or made expensive modifications to process lighter crude. Given the sheer cost, time, political risk, and current low oil price (~$60 currently; breakeven costs for key grades in Venezuela’s Orinoco belt already average more than $80 a barrel, according to estimates by consultancy Wood Mackenzie), we agree with the CEO of Exxon Mobil that the country’s oil industry is “uninvestable” at this moment. We do not expect Venezuelan supply to make a measurable impact on global oil supplies, and in turn, oil prices, in the foreseeable future.
Second, Iran. On 28 December, protests started in Tehran and initially focused on economic issues, including inflation (~60%), currency devaluation, widespread unemployment, low wages, and cutbacks in electricity and water supply, before turning into violent anti-government demonstrations and spreading throughout the country. The Iranian regime shut down internet and mobile communications, making accurate reporting of the demonstrations difficult—however, estimates of the death toll range from 2,500 to as high as 15,000. Protests against the Islamic regime have been a periodic occurrence since the 1979 Islamic Revolution, but the breadth of the participation and the severity of the government’s response this time is unprecedented. Trump has responded by threatening “strong military action” against Iran and declaring that he will impose a 25% tariff on any countries that engage in commerce with Iran (China, Iraq, and US allies UAE, Turkey are Iran’s major trading partners).
Iran was an even larger energy producer than Venezuela, but it too was hit with gross mismanagement, in addition to higher population-driven domestic demand and US-led sanctions. In 1974, Iranian oil production reached over 6 million barrels per day, but that figure is closer to 3.5 million today, with about 2 million being exported. While unrest in Iran could remove oil from the market in the short-term (current global consumption is ~103 million barrels per day), regime change could bring a more secular, capitalist environment that could result in a substantial increase in global oil supplies over the long term.
Moving from oil to security alliances, Trump has recently renewed his threat to seize control of Greenland from Denmark, “one way or the other.” In response, Denmark and seven of its European allies have sent politicians to Washington in an attempt to ease tensions while also symbolically sending troops to the semi-autonomous territory. This then induced Trump to threaten additional 10% tariffs on imports from these countries starting 1 February, escalating to 25% on 1 June. Although the economics of Greenland are inconsequential to AlphaGlider portfolios on a direct basis, such an action by the US would likely torch all military cooperation between the US and the rest of the countries in the North Atlantic Treaty Organization (NATO). Combined with the effects of existing US tariffs, we fear that bilateral trade between the US and the rest of the free world would be significantly harmed if this were to occur, which in turn would hurt the value of many investment assets, including AlphaGlider portfolios.
Nearly one year into the new administration, the US economy and the companies operating within it are navigating a complex landscape defined by many new headwinds and tailwinds. These factors are reshaping the investment environment, requiring a reevaluation of opportunities and risk.
On the positive side, several tailwinds continue to support corporate profitability and broader economic expansion. A more favorable tax code, supported by significant ongoing deficit spending, remains a primary catalyst for growth alongside a broad push for deregulation and a more permissive environment for corporate mergers. Energy prices remain low and continue to trend downward, providing relief to both consumers and industrials. Furthermore, the upcoming changeover in the Federal Reserve’s chairmanship in May suggests that real interest rates, already low by historical standards, are likely heading lower. Perhaps most significantly, the acceleration in artificial intelligence (AI) capital expenditures continues to be a massive engine for the economy; current estimates suggest AI-driven investment accounted for between one-half and two-thirds of total US GDP growth in 2025.
However, these supports are being met by significant headwinds that may hamper long-term growth potential. Trade policy is a primary concern, as new import tariffs have upended global supply chains. Simultaneously, a reduction in both legal and illegal immigration into the US is removing a key source of skilled and/or affordable labor, potentially tightening the labor market in ways that could fuel inflation. We are also closely monitoring the corrosion of established US norms regarding the rule of law and the administration’s public challenges to central bank independence (on Trump’s instructions, the US Justice Department recently announced Fed Chair Jerome Powell is under criminal investigation on bogus charges; here is Powell’s response). These shifts, coupled with a reduction in the scope and quality of government-collected economic and scientific data, have created a backdrop of heightened institutional uncertainty.
Another worrying shift over the last year is the increasing level of government intervention in the free-market economy. The Trump administration has taken direct equity stakes or "golden shares" in various technology, mineral, and industrial companies, including Intel and US Steel, while mandating a 15-25% cut on Nvidia and AMD AI chip sales to China. From directing oil industry investments in Venezuela to threatening bans on institutional purchases of single-family homes and on defense sector buybacks, the government’s heavy handed approach is unprecedented in recent history. This interventionist trend, also marked by direct pressure on CEOs to resign and proposed caps on credit card interest rates—introduces significant policy-induced uncertainty that may affect corporate strategy and capital allocation for the foreseeable future.
This slide into “state capitalism with American characteristics” risks making US companies less efficient and less productive over time, potentially lowering capital returns. It risks adding economic distortions, waste, cronyism, and kleptocracy into the US economy. It raises costs of doing business in ways we may not feel immediately, but that might over time degrade the economy, the companies that operate within it, and its citizens’ standard of living. History is clear that the state can’t allocate capital more efficiently than private markets.
It’s true that other foreign countries suffer from these same maladies to varying degrees. However from an investors’ standpoint, these maladies are currently discounted in their prices, and thus the risk they pose is dissipated. If you invest in countries where the economy is heavily influenced by the state, for example China, Brazil, Turkey, and Hungary, you expect a certain level of state intervention and perhaps corruption—and thus you will pay a lot less for a unit of earnings. According to Research Affiliates, the cyclically adjusted price to earnings ratio (CAPE; aka Shiller PE) for these countries is 15x, 10x, 7x, and 12x, respectively. Right now investors are paying ~40x CAPE for the US market (see chart below), indicating to us that the market does not share our concerns about what the Trump administration is doing. We fear that under the current trajectory of US governance, US company earnings growth will be harmed, and with it the multiples that investors are willing to pay for those earnings.
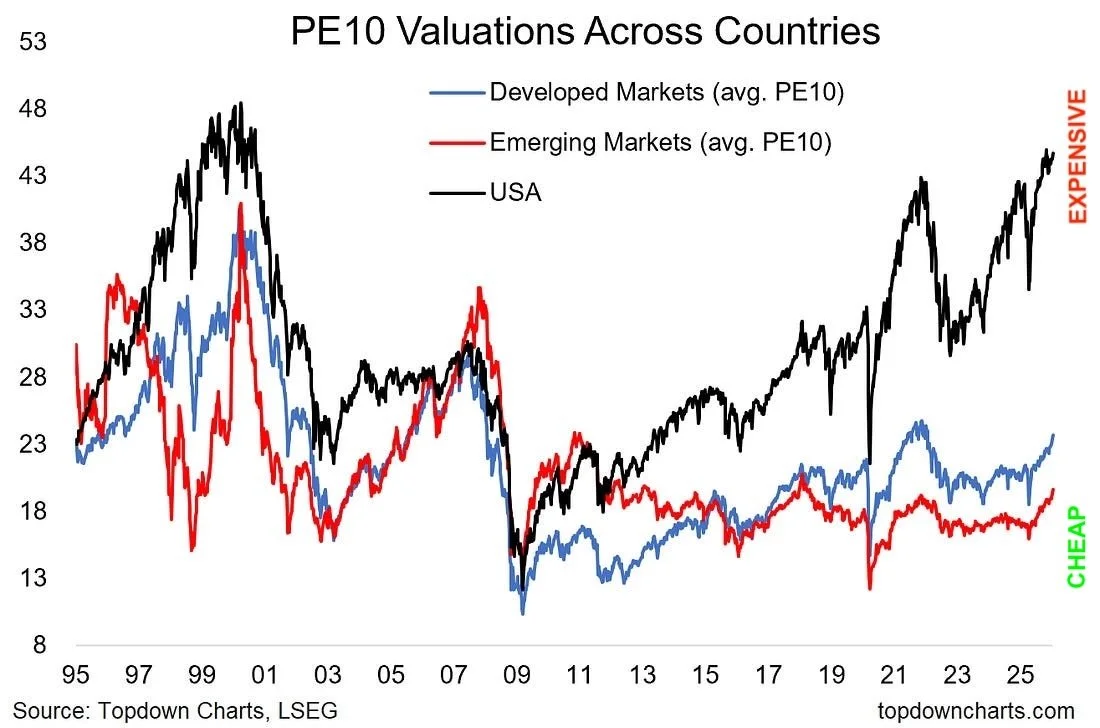
Source: Topdown Charts, AlphaGlider
PERFORMANCE DISCUSSION
Fourth Quarter
AlphaGlider strategies put up between 100% and 110% of their respective benchmarks’ returns during the fourth quarter despite being slightly underweight equities during a strong quarter for equities. Our ESG strategies performed inline with their Core strategy counterparts.
The primary driver of our strong performance was our overweighting of international equities and underweighting of US equities. An international equity market that we were strongly overweight (~125%), South Korea, was up over 25% during the quarter as measured by EWY, iShares MSCI South Korea ETF.
Within our strategies’ non-equities holdings, our emerging market bond fund turned in another strong quarter, as did our market neutral equity fund. Our diversified commodities fund, driven by prices for precious metals like gold and silver, also did well.
On the negative side, our strategies were held back by their slight underweighting to equities in general. Additionally, US small and mid cap equities, developed foreign bonds, and US inflation-protected Treasuries were a drag on performance.
Last 12 Months
AlphaGlider strategies generally performed inline their respective benchmarks over the course of 2025 (+/- 5% of their respective benchmarks’ returns), with most strategies up in the mid to high teens. Our aggressive strategies (AG-A & AG-A/esg) even broke 20% growth. Our Core strategies outperformed our ESG strategies.
The key drivers of our strategies’ performance over the last year were remarkably similar to drivers of the fourth quarter. Being overweight international equities and underweight US equities were important to our healthy returns throughout the year. And once again, South Korea was the standout performing equity market, nearly doubling during the year.
Emerging market bonds were also strong over the full year, up in the low teens. Our diversified commodities fund was up in the mid teens, again on the strength of precious metals. Our more aggressive ESG strategies benefited from their holding in a clean energy fund which was up nearly 50% during the year.
Detracting from our relative performance was our strategies’ positions in US equities, specifically small and mid cap, value, and quality stocks. On the fixed income side, we were hurt by our hedged international bond fund as well as our US inflation-protected Treasury funds.
LOOKING FORWARD
The meteoric rise in the US stock market over the last couple of years, in conjunction with the mediocre performance of bonds, has left many investment portfolios seriously out of whack. This is true for many “buy and hold” investors, and especially true for investors who have been chasing performance by selling what has lagged while buying more of what has worked. For an example of the former, a buy and hold investor who set up a “balanced” 60/40 US portfolio (that’s 60% equity like the S&P 500 Index, and 40% bonds like the Bloomberg US Aggregate Bond Index) three years ago would now own a 71/29 portfolio. If they had set up their balanced portfolio 10 years ago, they would now own an 83/17 portfolio. And going to extremes, they would now own an 93/7 portfolio if they started with a 60/40 portfolio back at the depths of the global financial crisis (GFC) in March 2009.
The problem with these out of whack portfolios is that they are substantially more vulnerable to an equity market downturn than their original, risk-appropriate portfolio. For example our buy and hold balanced investor, who let their 60/40 portfolio transform to an 83/17 portfolio over the last 10 years, would lose one-third of their investment over the coming 18 months if markets perform as they did following the March 2000 peak of the dot-com bubble. On the other hand, a balanced investor who periodically rebalanced4 their 60/40 portfolio would have only lost 16% of their investment during the 18 month bear market, half as much. Don’t get me wrong, it would still be painful for the 60/40 investor, but much less stressful and fewer sleepless nights than suffered by the buy and hold investor. Having lost “only” 16% of their portfolio value, our rebalancing investor would be more likely to have the nerve to sell bonds to buy more equities (i.e. rebalance) to get back to their optimal 60/40 equity/bond asset allocation than our “let it roll” investor who just lost one-third of their portfolio value.
Going back to my opening sentence of this section, how do I know that many investment portfolios are seriously out of whack? Cue the chart below which shows the proportion of equities in US household portfolios over time:
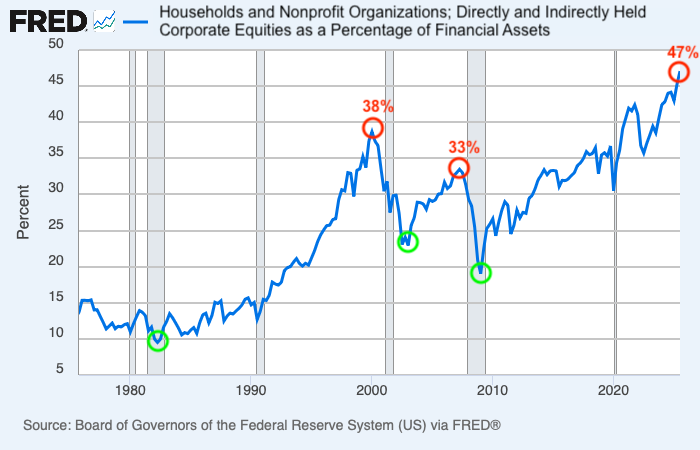
Source: Federal Reserve Bank of St. Louis (FRED), AlphaGlider
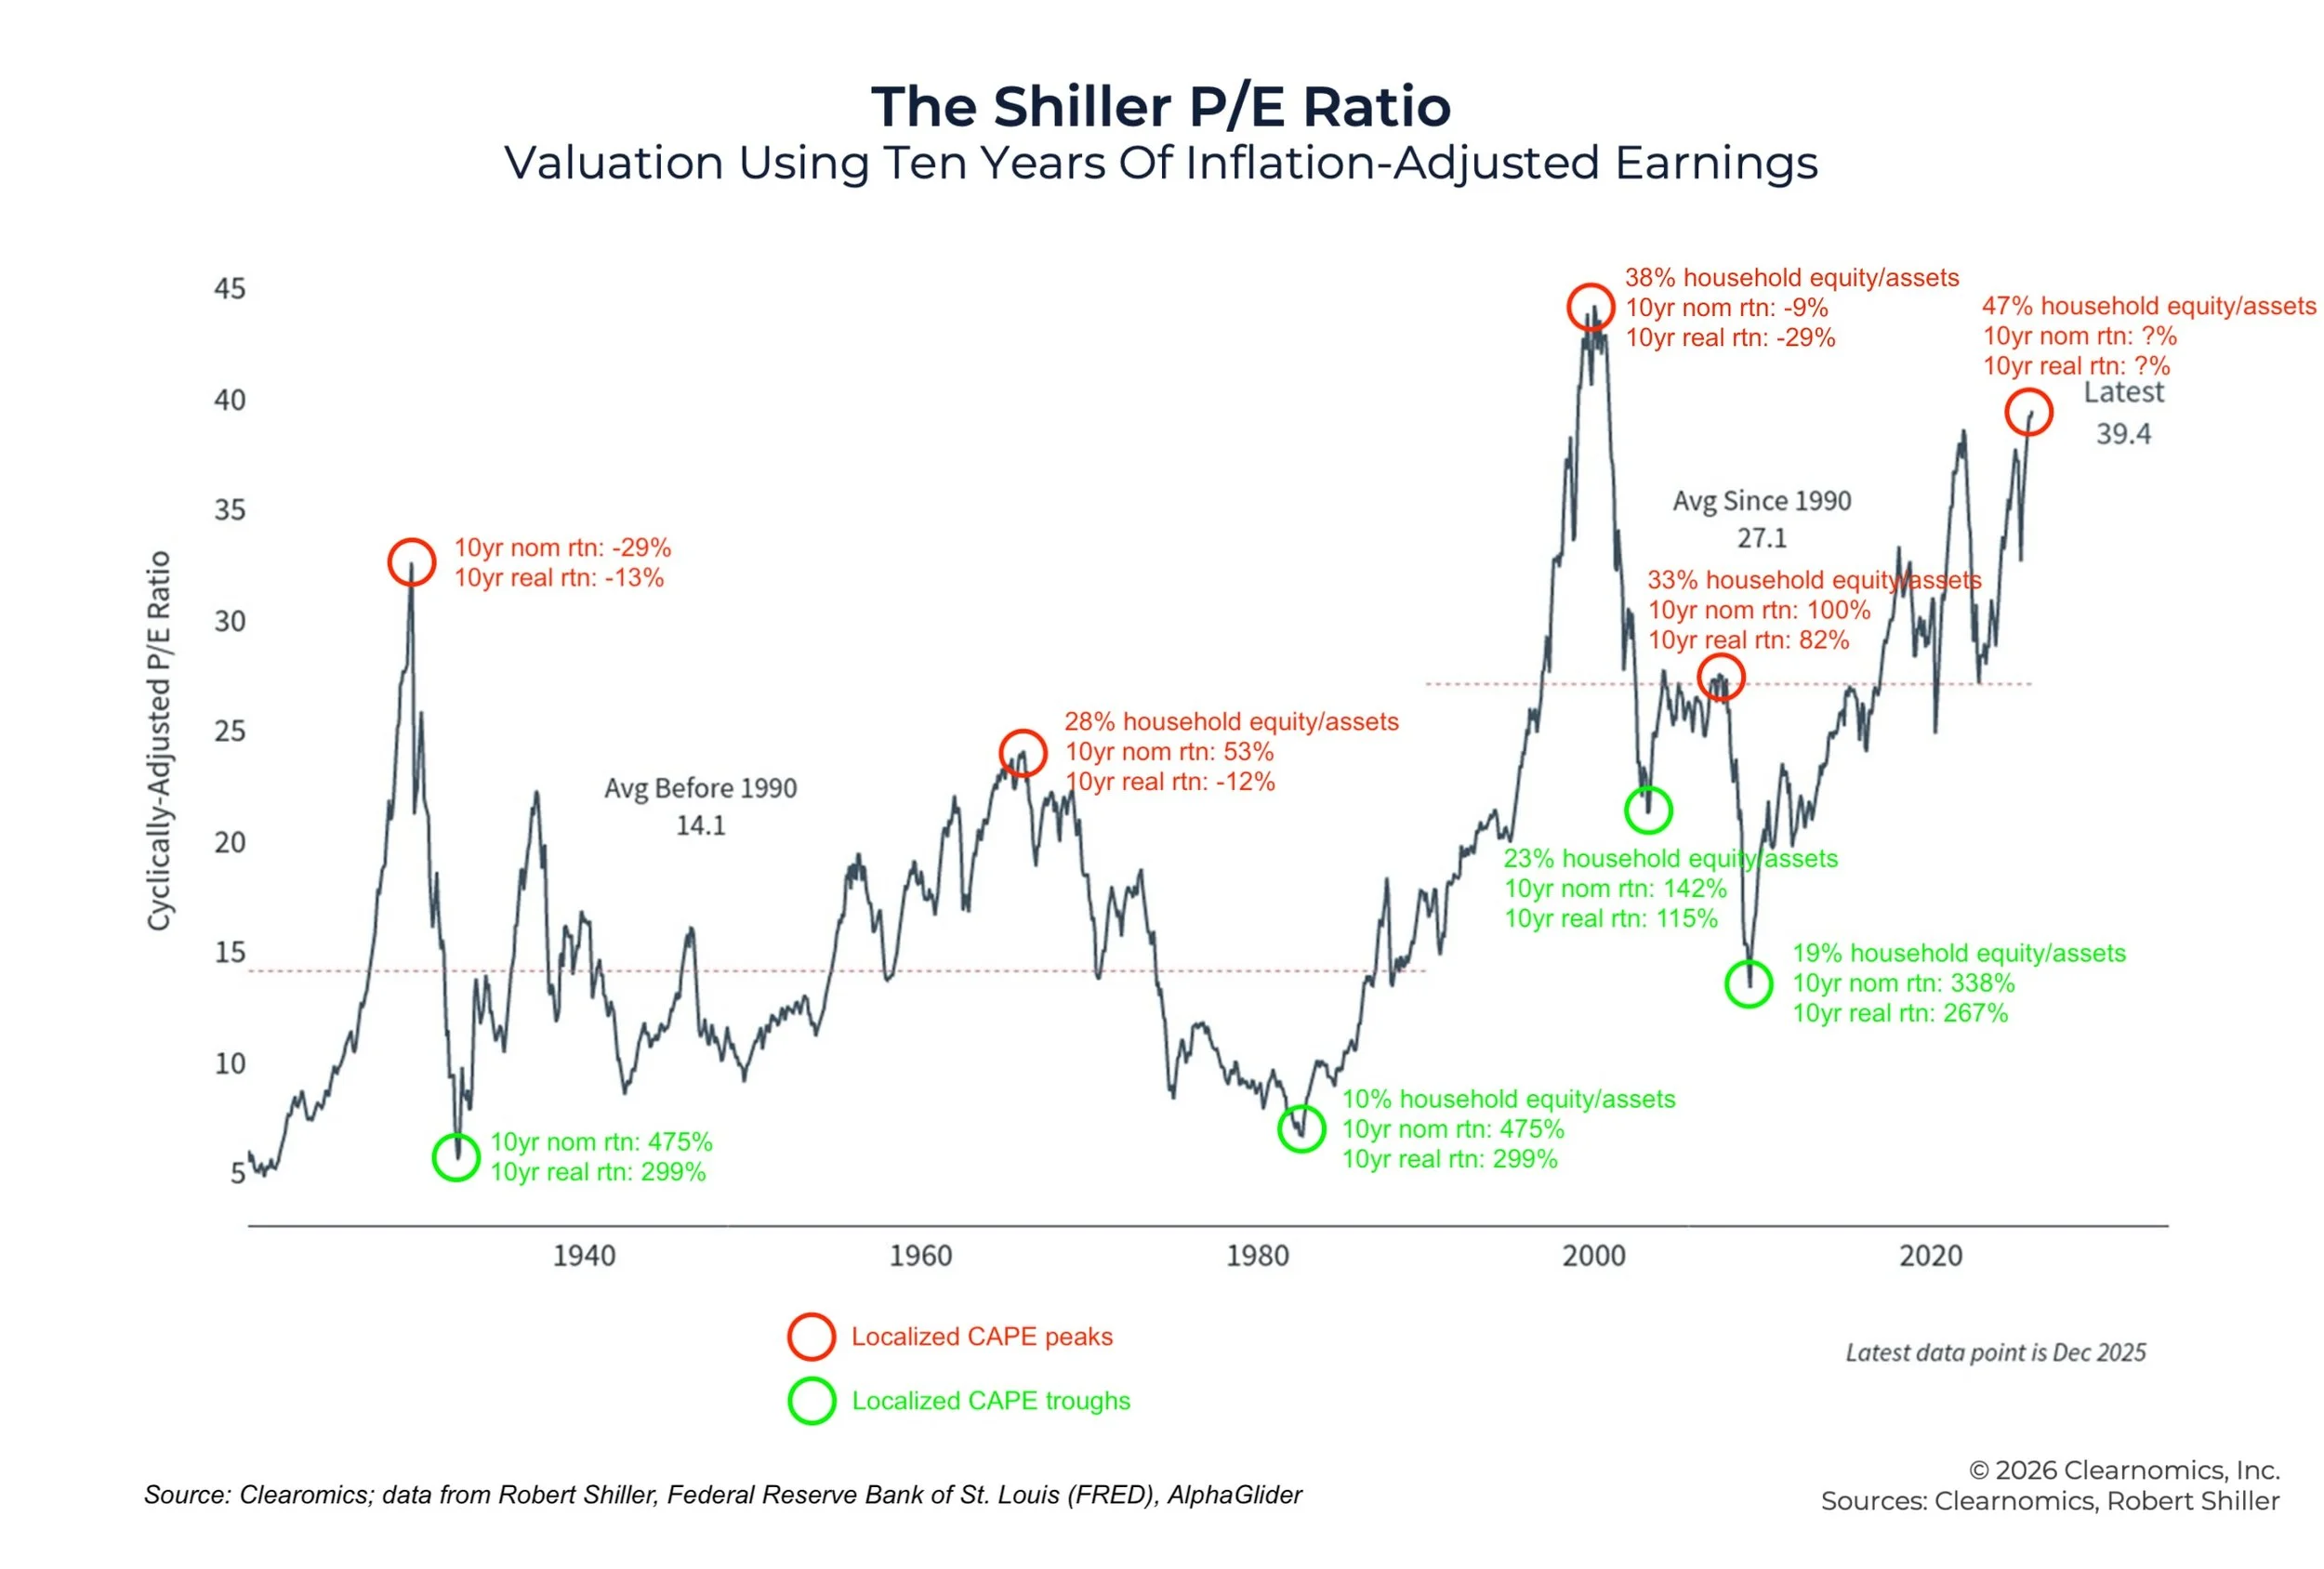
As of 1 July 2025, the latest datapoint on the chart, 47% of American households’ financial assets were in equities, an all-time high and meaningfully higher than the 38% cyclical peak reached just before the bursting of the dot-com bubble and the 33% cyclical peak hit just before the GFC—both horrible times to have been overweight equities (see chart below). Note that the cyclical lows of this ratio were reached in the early 1980s, early 2000s, and 2009, regretful times to have been underweight equities as most American households were (note that the chart shows subsequent cumulative 10-year nominal and return total returns at each localized CAPE peak and trough).
Obviously high household equity ownership isn’t the cause of equity bear markets and low ownership isn’t the cause of bull markets, but they are correlated. And this makes sense. It’s human nature to leave well enough alone, or even getting a little greedy by buying more of what’s gone up. It’s also human nature to avoid things that have recently burned you. That’s what makes investing so difficult. To be a successful investor, you need to be patient and contrarian. Legendary investor Warren Buffett said this many ways throughout his long investment career, but here are five of my favorite quotes of his on the topic:
- Be fearful when others are greedy, and be greedy when others are fearful.
- The stock market is a device for transferring money from the impatient to the patient.
- What the wise man does in the beginning, the fool does in the end.
- A bull market is like sex. It feels best just before it ends.
- People get fearful en masse. Confidence comes back one at a time.
Periodic rebalancing is the most obvious way to avoid an out of whack portfolio, and we do that with all of the portfolios that we manage. But we go a bit further, actively underweighting areas of the market that are more expensive than their growth prospects justify (i.e. bad risk-reward propositions), and overweight areas that are cheaper than their growth prospects justify. In this way we are doing the opposite of those “greedy” investors. The total return (including reinvesting dividends) of the S&P 500 increased 1266% between the March 2009 trough of the GFC and then end of 2025, blowing away the 413% gain from international markets as measured by the Vanguard FTSE All World ex-us ETF (VEU). This has resulted in extremely high US equity valuations, both versus its own history and relative to foreign equity markets. Some of this return disparity can be explained by US companies’ superior earnings growth (much of it driven more by superior margin expansion which may not be sustainable in the long term), a strengthening US dollar (also with questionable sustainability), but much of it has to do with a larger expansion in its earnings multiple (i.e. valuation). Currently the US equity market is trading around 40x its cyclically adjusted earnings (CAPE), short of its brief 44x peak during the dot-com bubble—but still higher than 99% of its history (see S&P 500 CAPE chart above). This is in stark contrast to foreign equity markets. According to Research Affiliates, foreign developed and emerging equity markets are trading on CAPE ratios around one-half that of the US equity market, 20.9x and 19.8x respectively. As a reminder to my readers, CAPE ratios are poor predictors of short-term performance (in common with most other valuation metrics), but have been somewhat reliable in predicting longer-term (e.g. 10-15 year) performance. Also note that localized peaks and troughs in CAPE ratios tend to appear with localized peaks and troughs in the ratio of households’ equity to total financial assets as laid out in the first chart of this section.
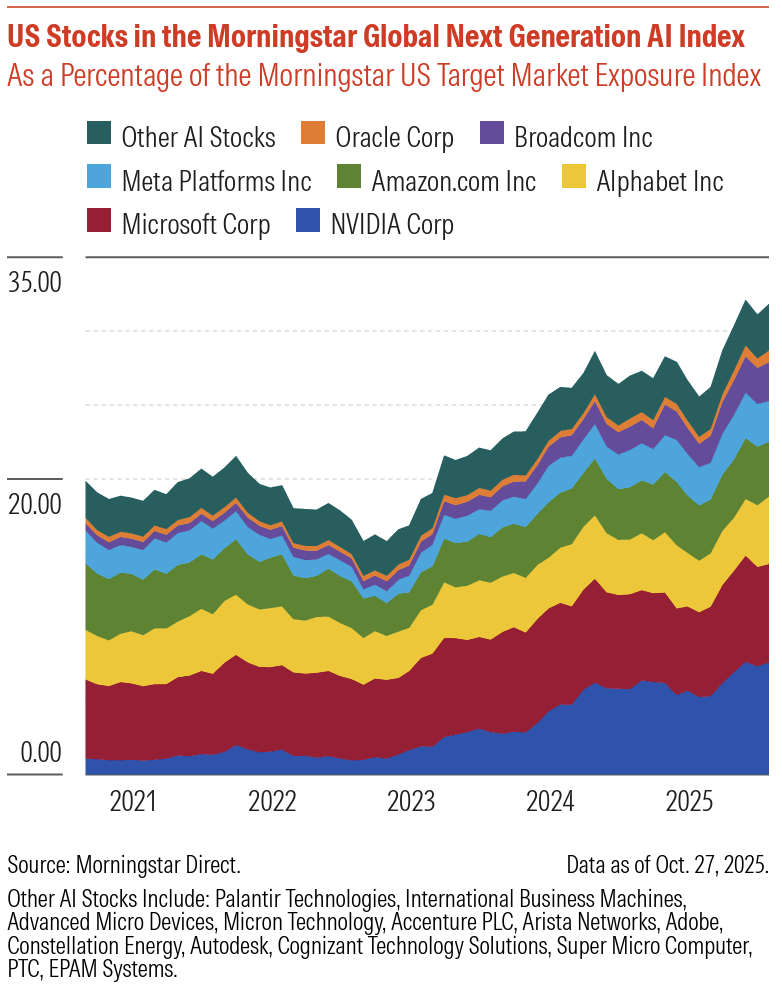
Who knows where the proportion of equities to total US household financial asset ownership will peak this time? Who knows where the S&P 500 CAPE will peak this time? But history is clear that you want to be underweight equities when everyone else owns them and their CAPE is high (i.e. periods of greed), and to be underweight equities when few own them and their CAPE is low (i.e. periods of fear). To us 2026 looks like a bad time to be overweight US equities, particularly the large technology firms that have done so well during this AI-driven bull market (and now make up one-third of the US equity market as shown to the right).
Right now AlphaGlider strategies are underweight US equities by approximately 25% relative to their benchmarks. And within our underweight US equity exposure, we are underweight large technology firms—instead favoring more reasonably priced small cap, large cap, value, and quality companies. We are also overweight most developed foreign equity markets relative to our benchmarks, such as an approximately 85% overweighting to Japan, 125% to S. Korea, and 20% to developed European countries—all regions that we find to be attractively valued.
NOTES & DISCLOSURES
1This material represents an assessment of the market and economic environment at a specific point in time and is not intended to be a forecast of future events, or a guarantee of future results. Forward-looking statements are subject to certain risks and uncertainties. Actual results, performance or achievements may differ materially from those expressed or implied. Information is based on data gathered from what we believe are reliable sources. It is not guaranteed as to accuracy, does not purport to be complete, and is not intended to be used as a primary basis for investment decisions. It should also not be construed as advice meeting the particular investment needs of any investor.
2Mutual funds, exchange-traded funds and exchange-traded notes are sold by prospectus. Please consider the investment objectives, risks, charges, and expenses carefully before investing. The prospectus, which contains this and other information about the investment company, can be obtained directly from the Fund Company or your financial professional. Be sure to read the prospectus carefully before deciding whether to invest.
3Alternative investments, including hedge funds, commodities and managed futures involve a high degree of risk, often engage in leveraging and other speculative investments practices that may increase risk of investment loss, can be highly illiquid, are not required to provide periodic pricing or valuation information to investors, may involve complex tax structures and delays in distributing important tax information, are subject to the same regulatory requirements as mutual funds, often charge higher fees which may offset any trading profits, and in many cases the underlying investments are not transparent and are known only to the investment manager. The performance of alternative investments including hedge funds and managed futures can be volatile. Often, hedge funds or managed futures account managers have total trading authority over their funds or accounts; the use of a single advisor applying generally similar trading programs could mean lack of diversification and, consequently, higher risk. There is often no secondary market for an investor’s interest in alternative investments, including hedge funds and managed futures and none is expected to develop. There may be restrictions on transferring interests in any alternative investment. Alternative investment products including hedge funds and managed futures often execute a substantial portion of their trades on non-US exchanges. Investing in foreign markets may entail risks that differ from those associated with investments in the US markets. Additionally, alternative investments including hedge funds and managed futures often entail commodity trading which can involve substantial risk of loss.
4Rebalancing can entail transaction costs and tax consequences that should be considered when determining a rebalancing strategy.
5AlphaGlider LLC does not offer legal or tax advice. Please consult the appropriate professional regarding your individual circumstance.
^Indices are unmanaged and investors cannot invest directly in an index. The performance of indices do not account for any fees, commissions or other expenses that would be incurred.
aThe Standard & Poor's 500 (S&P 500) Index is a free float-adjusted market capitalization weighted index that is designed to measure large cap US equities. The index includes 500 leading companies and captures approximately 80% coverage of available market capitalization in the US equity markets.
bMSCI Europe, Australasia and Far East (EAFE) Index is a free float-adjusted market capitalization weighted index that is designed to measure the investable universe of developed market equities outside of the US.
cMSCI Emerging Markets (EM) Index is a free float-adjusted market capitalization weighted index that is designed to measure large and mid-cap equity market performance in the global Emerging Markets.
dMSCI All-Country World (ACWI) Investable Market Index (IMI) is a free float-adjusted market capitalization weighted index that is designed to measure the investable universe of global equity markets.
eThe Bloomberg Barclays US Aggregate Bond Index is a market capitalization weighted index that is designed to track most investment grade bonds traded in the United States. The index includes Treasury securities, government agency bonds, mortgage-backed bonds, corporate bonds and a small amount of foreign bonds traded in the United States. Municipal bonds and Treasury Inflation-Protected Securities (TIPS) are excluded due to tax treatment issues.
Copyright © 2026 AlphaGlider LLC. All Rights Reserved.
No part of this report may be reproduced in any manner without the express written permission of AlphaGlider LLC.