

Photo credit: j4p4n, CC0, via Wikimedia Commons
INVESTMENT ENVIRONMENT1
Source: Orion Advisor Services, AlphaGlider
The temporary cessation of hostilities in the Middle East sparked a worldwide equity rally during the second quarter. The global equity market, as measured by the MSCI ACWI IMI Index,^d was up nearly 15% during the quarter. Emerging markets (MSCI Emerging Markets Indexc) led the way with a 24.1% increase on the back of strong performance from S. Korean memory chipmakers and Taiwanese contract chip manufacturers—all beneficiaries of the artificial intelligence (AI) data center buildout. The US equity market (S&P 500a) increased nearly 15% while foreign developed markets (MSCI EAFEb) lagged with a still stellar 10.8% gain. Fixed income markets muddled along with a 0.7% gain from our fixed income benchmark, the Bloomberg US Aggregate Index.e
Over the last 12 months, equity returns were even stronger. Global equity markets increased 24.2%, again led by emerging markets which expanded 43.5%. The US and foreign developed markets performed similarly, with percentage gains in the low 20s. Fixed income had steady growth, with our fixed income benchmark increasing 3.8%.
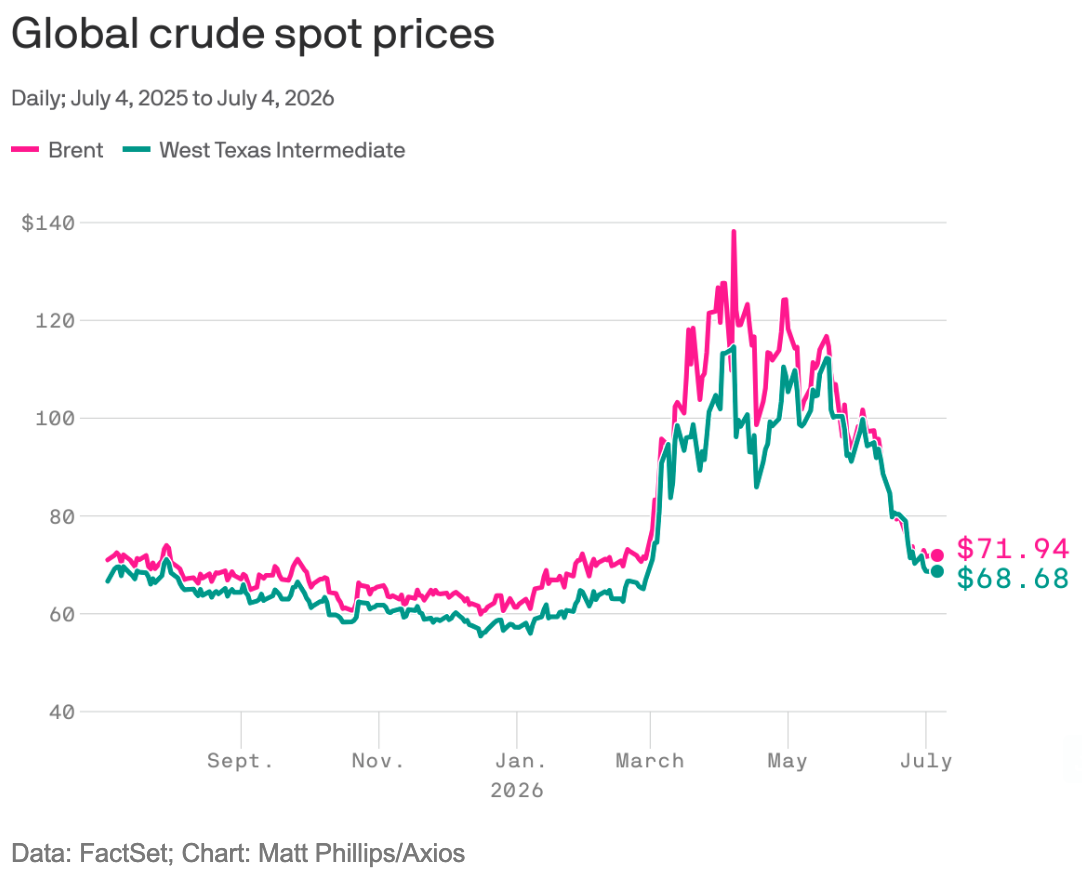
Source: Axios
The US and Iran struck a ceasefire deal early in the second quarter, allowing for discussions that ultimately led to a 14-point “memorandum of understanding” between the two nations in mid-June to deescalate and establish a framework for long-term negotiations over Iran’s nuclear program, US sanctions and asset freezes on Iran, funding to reconstruct and develop Iran, and the administration of the Strait of Hormuz. As a result, oil prices progressively fell throughout the quarter, and then rapidly when the memorandum was signed (see above right). Further adding to the downward pressure on oil prices was the United Arab Emirates’ (UAEs’) decision to withdraw from the Organization of the Petroleum Exporting Countries (OPEC; UAE was the second largest exporter of oil in dollar termsto Saudi Arabia in OPEC) and a spike in Russian oil exports due to a 20 to 40% decline in its oil refining capacity was disabled by Ukrainian drone attacks. As we are all too aware at the moment, the ceasefire between the US and Iran fell apart in early July. As I write this, Brent crude has rebounded to ~$88/barrel.
The closure of the Strait of Hormuz, through which approximately one-fifth of the world’s oil (~20m barrels/day) and gas transited before the war, did not cause oil prices to increase as much as most industry analysts forecasted. In fact, several factors seem to be working in conjunction to dampen price increases: 1) rerouting via pipelines to the Red Sea, Gulf of Oman and Mediterranean, 2) the release of oil from strategic reserves, particularly China, 3) increase in production, particularly in the US, 4) substitution to coal and renewable energy sources, particularly China, 5) price-related demand destruction, and 6) market expectations that the Strait of Hormuz would reopen before strategic reserves were emptied. With the war back on and the Strait closed once again, there is a real risk we could see oil prices test the highs achieved this spring, especially if the war drags on and Iran attacks Gulf States’ vulnerable pipelines. However, with the November US midterm elections fast approaching, Iran and a majority of investors appear to be banking on President Trump backing down in order to minimize the conflict’s impact on American voters’ pocketbooks.
The massive expenditure on AI data centers continues at breakneck pace. Bloomberg estimates the 14 largest publicly owned global data center operators will spend nearly $750 billion this year on AI infrastructure, an increase of 67% over 2025. These operators, most of which generated large amounts of free cash flow from other operations (think Alphabet with search advertising and cloud computing, Meta with social media advertising, Amazon with e-commerce and cloud computing, Microsoft with cloud computing, Oracle with enterprise software and cloud computing), are now plowing all of that cash flow, and then some, into AI capital expenditures (CAPEX). The buildout has caused shortages and corresponding price spikes in various components going into these data centers, specifically AI optimized processors and memory.
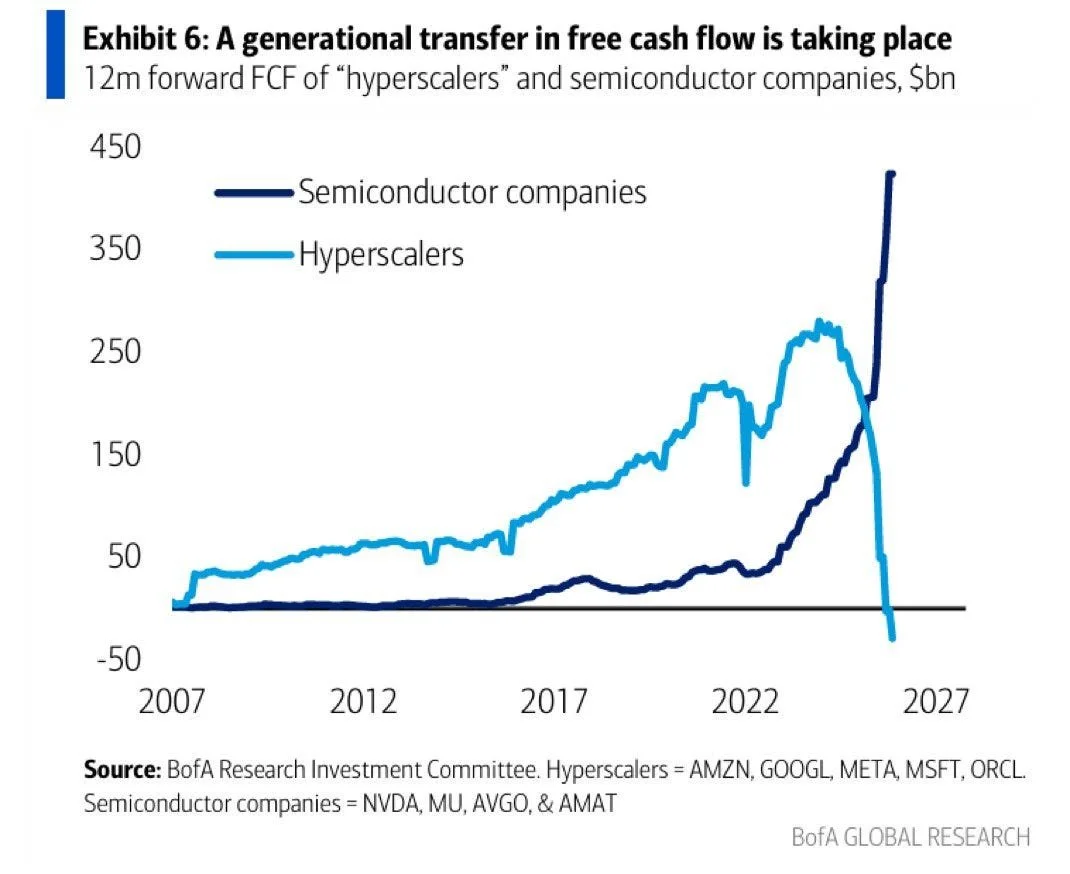
The chart on the left shows the recent collapse in free cash flow of the biggest American data center operators (i.e. hyperscalers) and the corresponding spike in free cash flow of the biggest American AI chip and memory makers (i.e. semiconductor companies). We are seeing a massive shift in cash from the hyperscalers to the semiconductor industry. Nvidia was the initial darling of investors playing the AI buildout, but this year it is the memory makers who have seen their commoditized and cyclical business turn into gold. Below is the chart of market capitalization over time for the three largest memory makers, SK Hynix and Samsung of S. Korea, and Micron of the US.
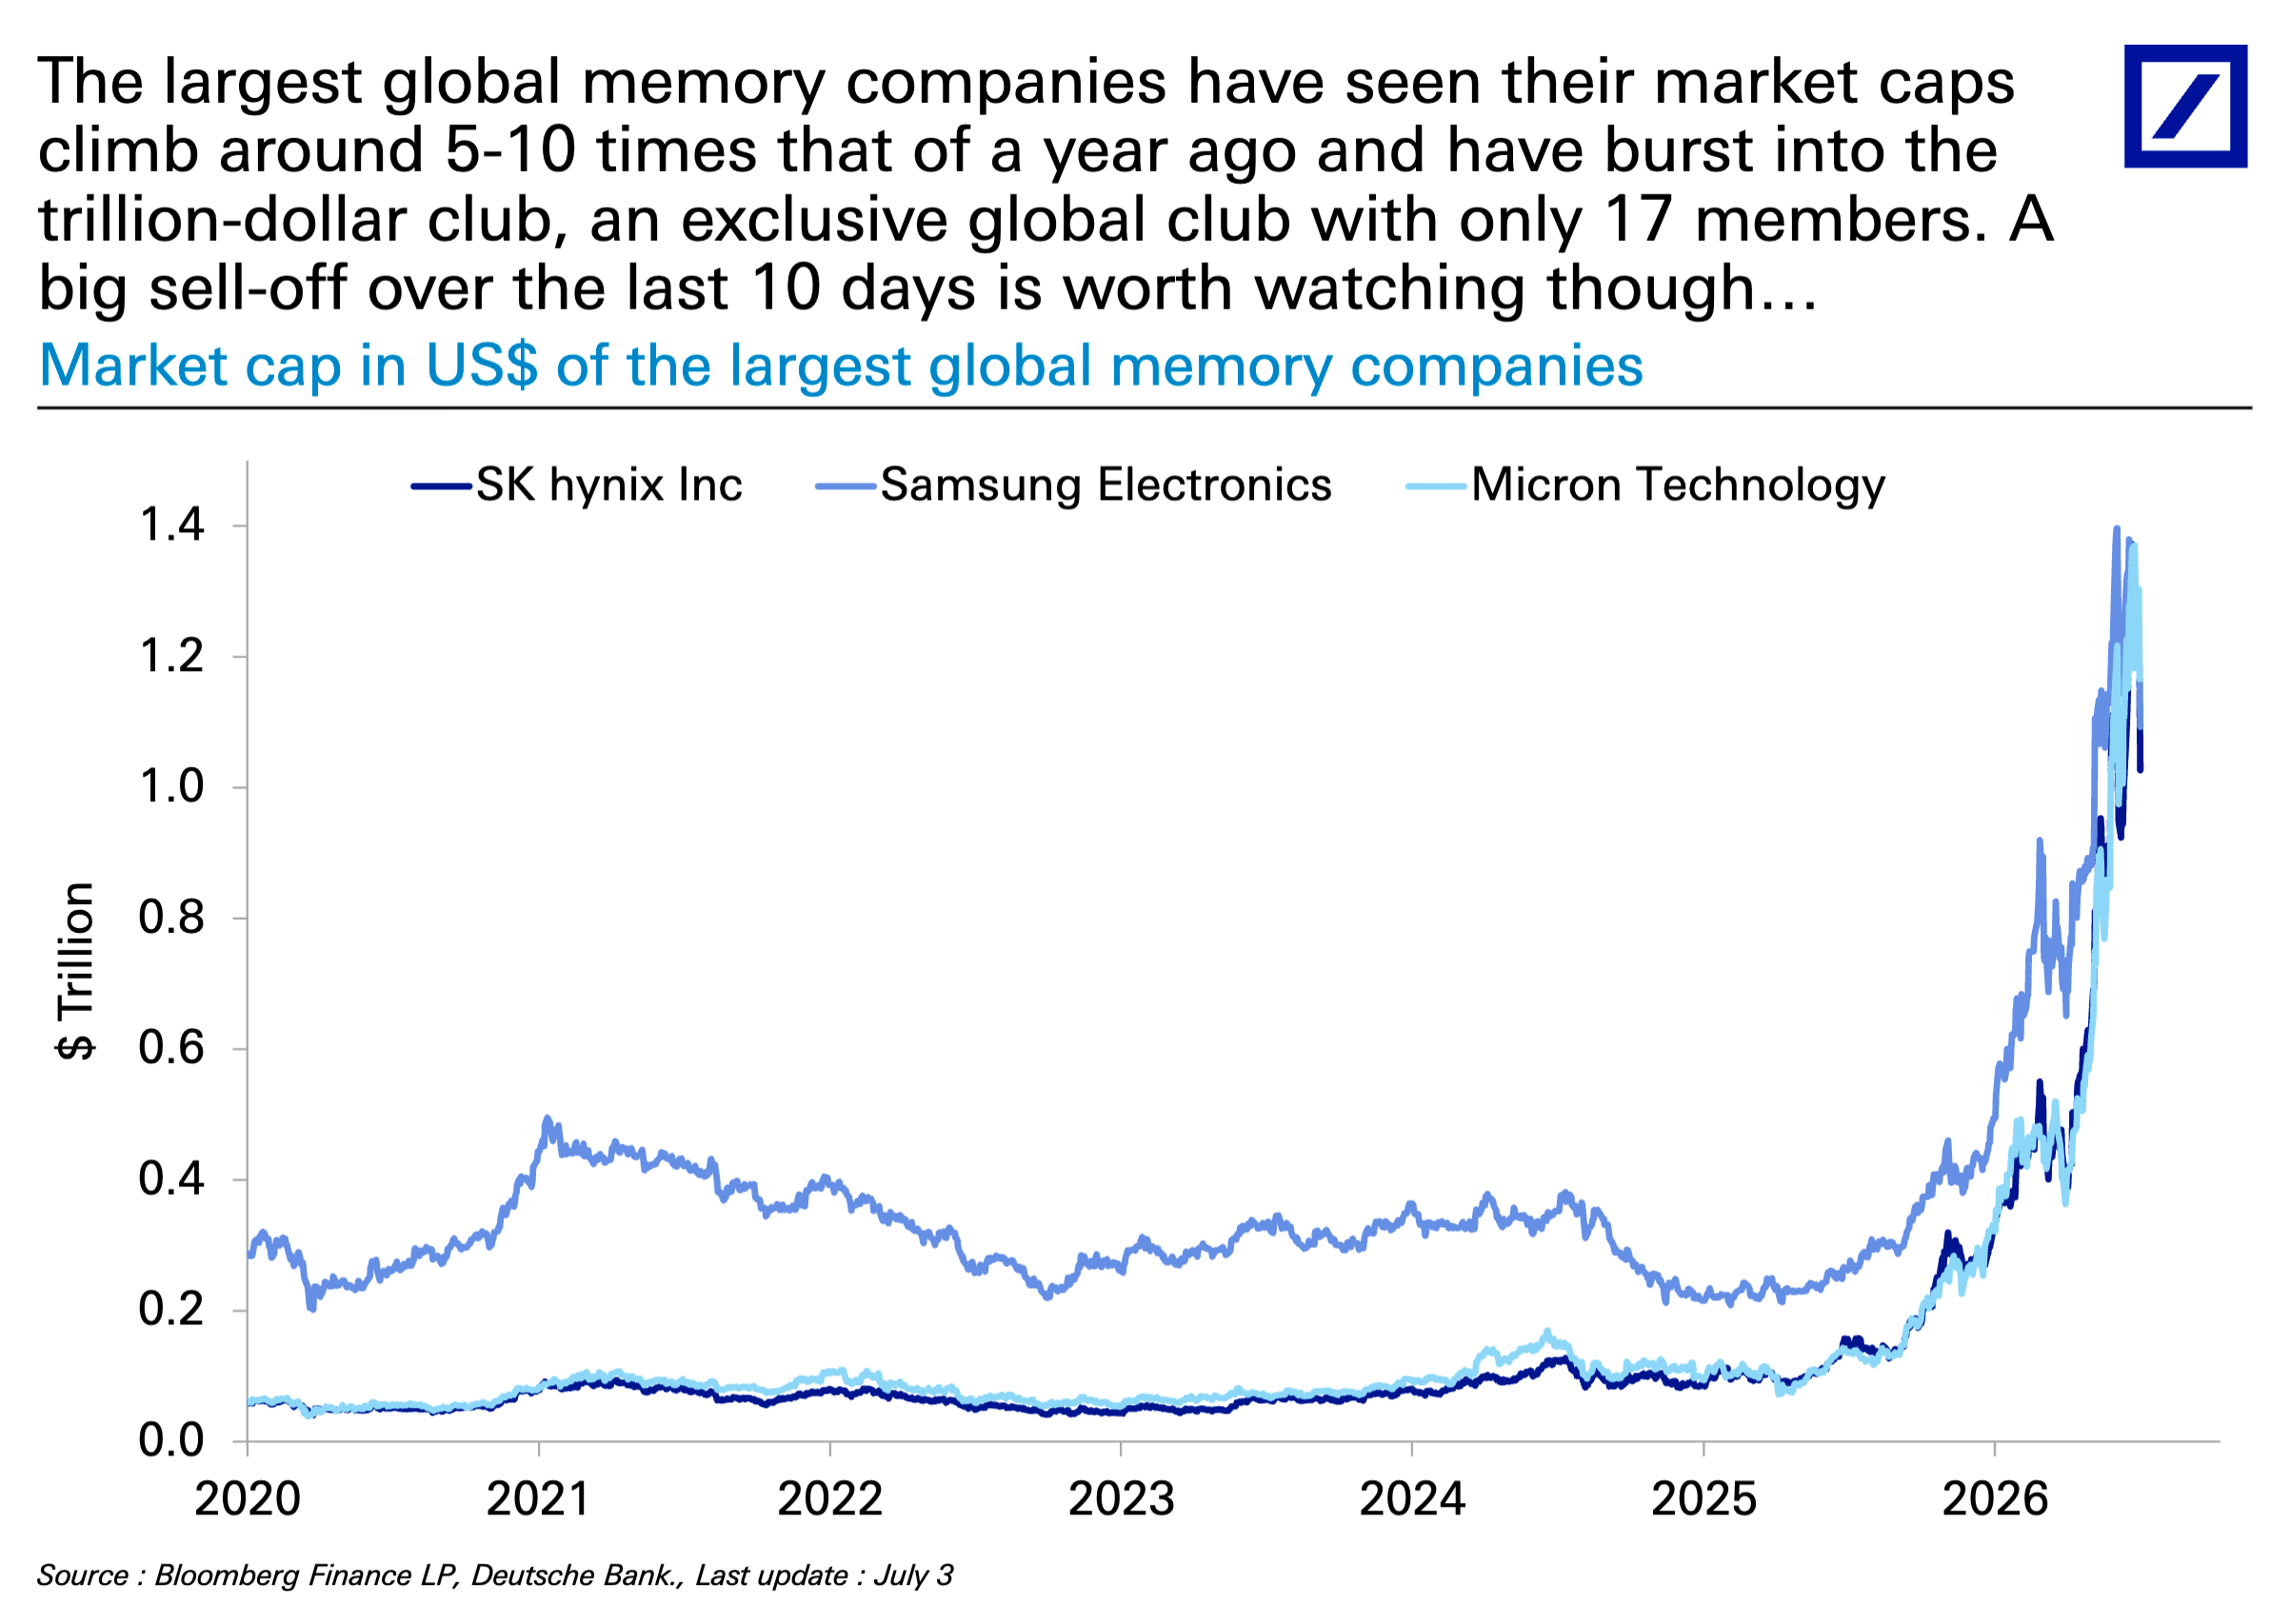
Source: Deutsche Bank
The money to build out the AI data centers is not only coming from the free cash flow of dominant legacy business lines, but also from investors. In the last year we’ve seen OpenAI and Anthropic raise $122bn and $65bn, respectively, from private equity issues. SpaceX (Elon Musk’s space/social media/AI conglomerate spending most of its CAPEX on AI data center capacity, not rockets) and SK Hynix raised funds by selling shares in initial public offerings (IPOs), $86bn and $26.5bn, respectively. Oracle and SpaceX have issued debt to the tune of $43bn and $25bn, respectively, over the last year. And we expect Anthropic to raise substantial funds in an upcoming October IPO, with Open AI to follow in 2027. This is an economy driven by AI at the moment.
After the Supreme Court struck down many of Trump’s tariffs in February, Trump promised to reimpose them under different authority. That time appears to have arrived. Earlier this month his administration announced 25% tariffs on most Brazilian goods starting on July 22 after a Section 301 investigation determined that Brazil has engaged in “unfair” trade practices. Another Section 301 investigation found that 60 countries, including the European Union (EU), engaged in or ignored forced labor practices and has proposed 10 to 12.5% tariffs against them. Those tariffs are currently being discussed in public hearings. Finally, the Trump administration declined to renew the US-Mexico-Canada Agreement (USMCA) for another 16-year term, opting instead to initiate a 10-year rolling annual review period. US and foreign businesses operating across US borders continue to struggle with the deleterious and constantly changing rules being dictated by the Trump administration.
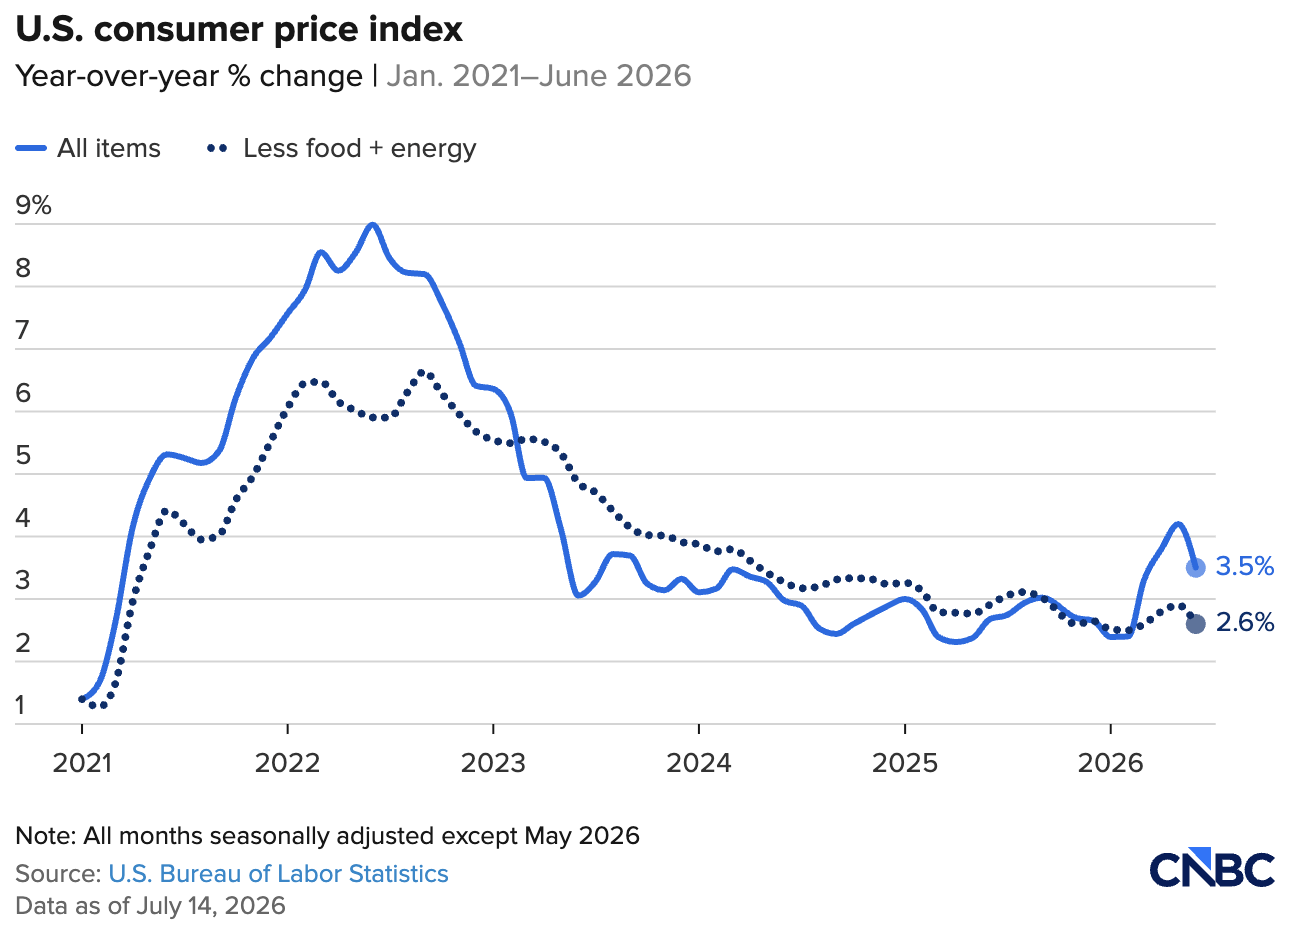
After the Trump Department of Justice backed down on its criminal probe of Federal Reserve (Fed) Chair Jerome Powell, the Senate confirmed Kevin Warsh as the new Fed chair. Like his predecessor, Warsh is under pressure from Trump to lower interest rates. However it appears that Warsh will not bend to Trump’s request, so long as inflation continues to run hot. As the above chart shows, it has now been over five years since US inflation, as measured by the consumer price index (CPI), has been above the Fed’s 2 percent target. The Federal Open market Committee (FOMC) held rates steady at 3.5-3.75% at Warsh’s first meeting. Warsh has set up five different task forces to study various aspects about how the Fed processes, including communications, inflation frameworks, economic-data quality, productivity and jobs, and its balance sheet. These task forces will take some time to develop recommendations, but the immediate impact of Warsh’s tenure is reduced communication on the Fed’s current thinking about future interest rates. With the oil prices rising again, tariffs being reapplied, and continued inflationary pressure from the AI data center buildout, the market is currently pricing in at least one 25 basis point (0.25%) increase before year end.
LOOKING FORWARD
Social security is an integral source of income for most American retirees today. It is important as it is often a retiree’s sole source of inflation-adjusting income that is linked to longevity. Outliving one’s savings is one of several risk factors we model out and stress test for our clients at AlphaGlider, and maximizing social security benefits is an important lever they have to deal with the good fortune of living longer than they expect. It’s this importance to so many Americans that makes reading the latest Social Security Trustees’ Report so painful.
In the report they released last month, the Trustees project that the combined Social Security trust funds will run dry in 2033 in the absence of Congressional action. That doesn’t mean the end of Social Security, but it would mark the beginning of meaningful benefit reductions. If Congress doesn’t address the issue, all participants will face a 17% reduction in benefits starting sometime in 2033, with reductions progressively growing to 35% by 2100 (assuming Social Securities OASI and SSDI trust funds were theoretically combined).
Backing up a bit, in plain English I’ll try to explain how Social Security works and a little about its history. As you may have heard before, Social Security is a pay-as-you-go system. When there is more revenue (i.e. Social Security taxes) collected than benefits paid out, the surplus is deposited into the Social Security trust funds where it earns interest. This was the case from 1983, when bipartisan Congressional reforms improved the program’s finances, until 2010. This can be seen on the following chart for the years that revenue collected (blue line) was greater than the benefits paid (red line), as a percentage of taxable payroll.
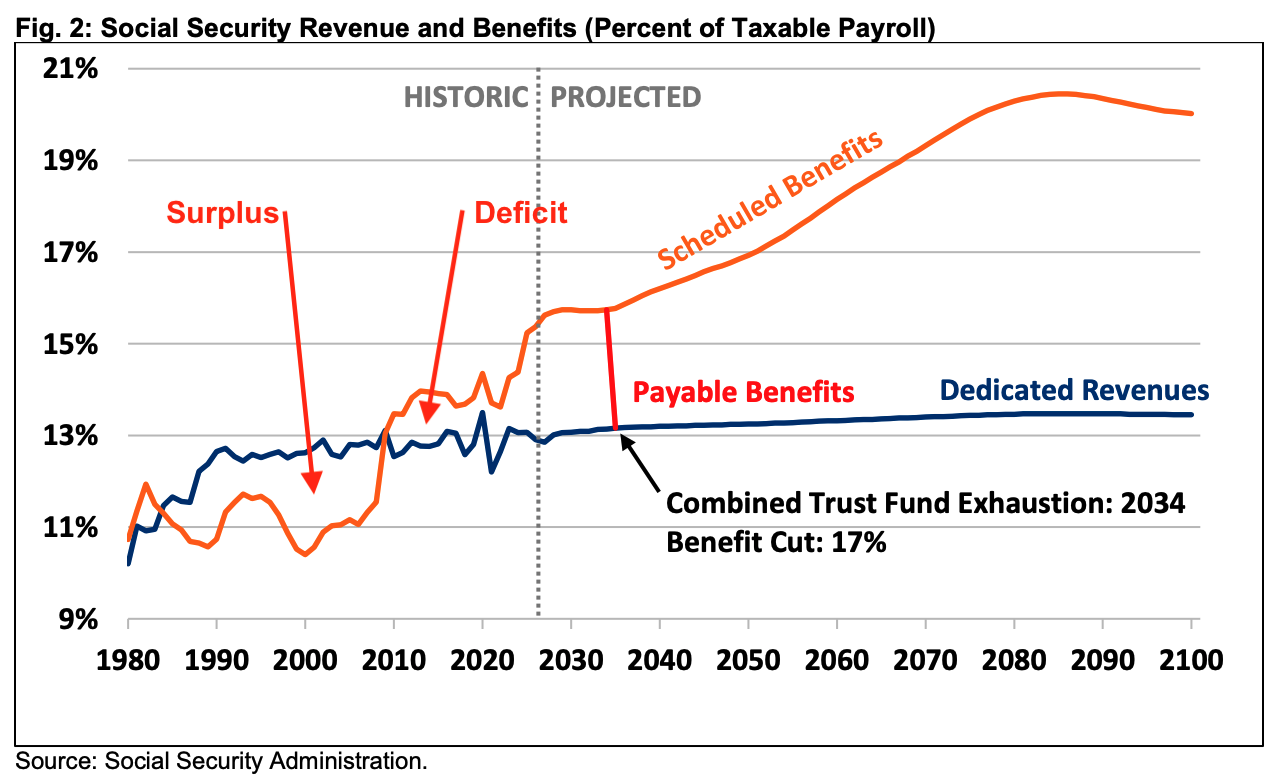
Coming out of the 2008 Global Financial Crisis , the surplus going into the trust funds flipped to a deficit—caused by a spike in unemployment that decreased revenues, and the related surge in 60-somethings entering the program that increased payable benefits. But the bigger, longer-term issue for the health of Social Security has always been demographics—more specifically, the falling ratio of workers paying into the program to the retirees collecting from it. As the chart below shows, there were five workers for every beneficiary entering the 1960s.
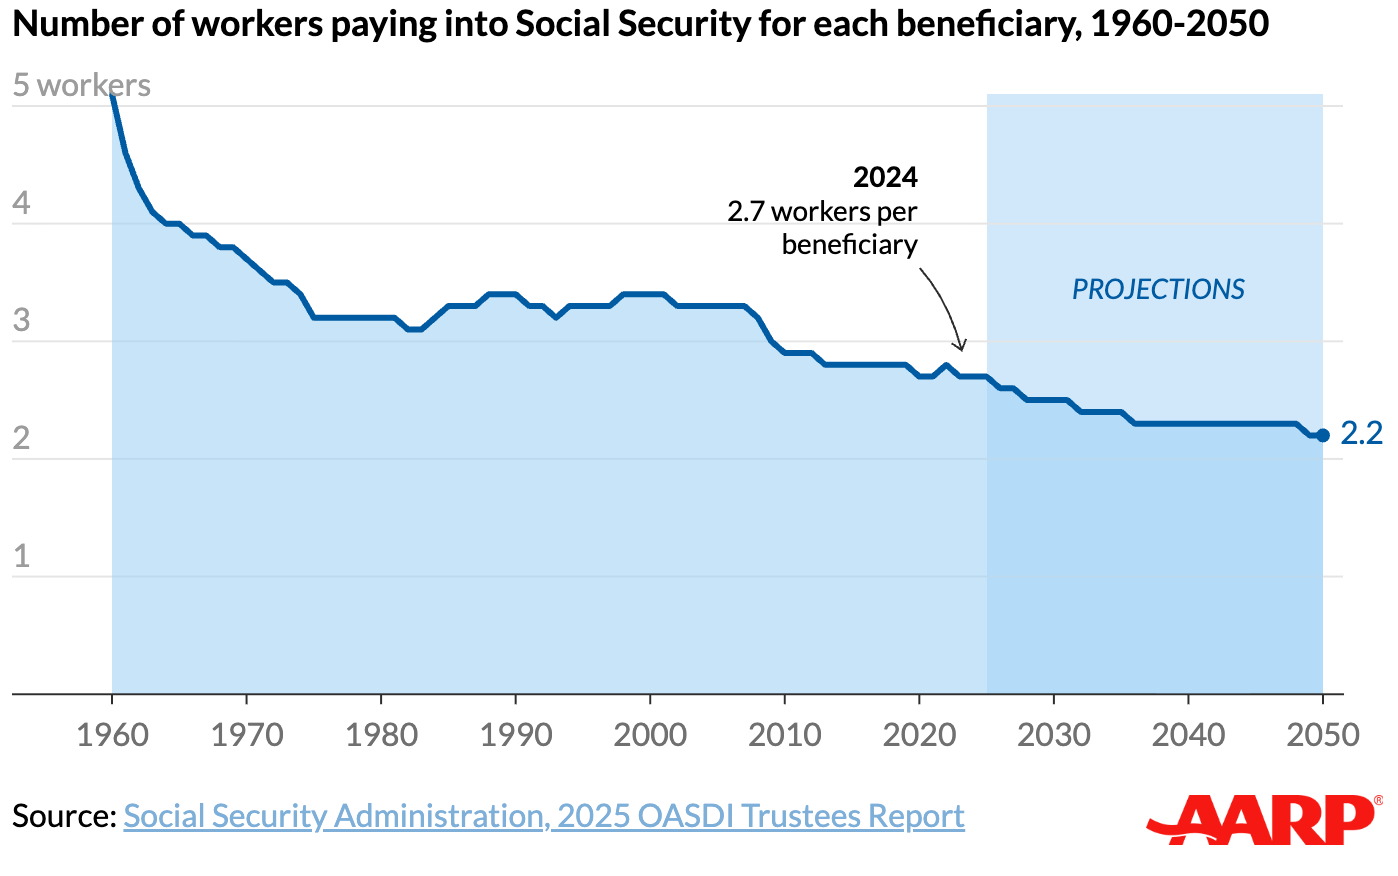
By the early 1980s, this ratio had fallen to 3.1, putting the program in serious trouble. In response, Congress stabilized the program with benefit cuts and tax increases. Benefit cuts included gradually raising the full retirement age from 65 to 67, delaying cost of living adjustments (COLAs) by six months, and reducing benefits for individuals receiving pensions from jobs not covered by Social Security. Tax increases included a gradual increase in payroll tax rates and the introduction of taxes on up to 50% of Social Security benefits.
Fast forward to today and there are 2.6 workers per beneficiary and a new, lowered Trustees' forecast of only 2.0 in 2065 that worsens the long-term outlook for the trusts—the result of the Trustees lowering their long-term fertility rate assumption from 1.9 to 1.75 children per woman (still seems optimistic as the rate was 1.6 in 2024), and their assumptions of reduced immigration caused by the Trump administration’s crackdown on both illegal and legal immigration. Also worsening the Trustees’ financial outlook for the trusts is the Trump administration’s temporary $6,000 senior bonus tax deduction (lowers tax collected on Social Security benefits) and its reinstatement of benefits to individuals receiving pensions from jobs not covered by Social Security that were stopped by the 1983 Social Security changes.
With all of this in mind, it raises the question what should we be assuming for Social Security benefits in our own financial planning models. Do we assume that lawmakers fail to act, forcing all beneficiaries to take a 17% haircut on their benefits starting in 2033, with further cuts thereafter as the worker to beneficiary ratio continues to fall? Or do we assume that lawmakers act now to permanently balance the program’s budget by immediately cutting payouts for all beneficiaries by 25%, per the Committee for a Responsible Federal Budget (CRFB). Or do we assume that lawmakers won’t touch current beneficiary payouts but only those for new beneficiaries, in which case it would take a 30% reduction in benefits for those new beneficiaries. Or just as in the late 1970s when Social Security was in trouble, will lawmakers procrastinate until the very last moment? Probably. If that’s the case, the benefit reductions would be 15% larger (29% cut to benefits if applied to all, 35% if applied only to new beneficiaries).
Lawmakers could also fix the program by instead raising taxes while keeping the program’s current benefit obligations (i.e. what you see in your annual Social Security statement). This would require an immediate 34% increase in the payroll tax rate, from its current 12.4% (shared 50/50 by employee and employer) to 16.65%. If the lawmakers wait until 2033, a 40% increase (to 17.36%) would be required.
To date, neither political party has been eager to be the bearer of bad news to the public, in fear that proposing cuts to Social Security or increasing taxes would hurt their chances in the upcoming election. House speaker Mike Johnson says Republicans have a plan to tackle “entitlement programs” next year, but that’s an easy promise to make when betting markets forecast an 84% chance your party loses control of the House this fall.
Regardless of which party does control the House and Senate after the upcoming midterms, we suspect that there will be little clarity on the future of Social Security up until right before the Social Security trust funds are nearly empty. When this does happen, in about seven years’ time, we think that Congress will use a combination of benefit cuts and tax increases to right the ship again, just as in 1983. We also think that any benefit cuts and tax increases will impact the young much more than those already in retirement or close to it. Why? First, there’s an element of fairness to the older people who completed most of their payments into the system and thus deserve the benefits they’ve been promised for all of these years. Second, there’s another element of fairness to the older people who have less ability to adjust to a reduction in a key benefit like Social Security, whereas young people have more years to sock away more savings to compensate for the reduction in Social Security benefits. But for what it’s worth, I also don’t think it’s entirely fair for younger people to bear the brunt of changes to the program as today’s problems were a result of Congress undertaxing and overpromising benefits to today’s older people for decades—really since the 1983 Congressional changes. But in the end of the day, politics will dictate who will lose more when Congress does eventually change the program. And since older people come out to vote in greater numbers than younger people, it’s likely that younger people will draw the short straw.
How will these benefits get cut? We think the primary mechanism will be by raising the full retirement age (FRA), thereby paying out benefits over fewer years. Back in 1983, Congress raised the FRA by two years to 67. Since that time, US life expectancy has risen by five years, from 74.4 to 79.5. Given this fact, raising the FRA makes intuitive sense as well as political sense, as Congress will likely apply any increase over a decade or longer—leaving those 60 and older unaffected. I’m guessing the FRA goes to at least 70, maybe higher. Other ways to cut benefits that have been discussed are to cap benefits for high-earning retirees (popular among Democrats) and to change the COLA formula to slow inflation adjustments to benefits (popular among Republicans).
How will revenues (i.e. taxes) be increased? We think Congress will likely aim for a combination of higher Social Security tax rates (as mentioned earlier, they are currently at a combined 12.4%) and a lifting, if not complete removal of the salary cap above which payroll isn’t exposed to Social Security taxes (currently $184,500). As these only impact earned income, these changes would not impact older people who have retired or will soon retire. Another potential source of revenue would be to raise the amount of Social Security benefits that are taxable.
Another option for Congress to “fix” Social Security would be to change the program’s budget and spending rules to allow it to borrow money like the rest of the government. But with government debt now above 100% of gross domestic product (GDP), the bond market may make this option unpalatable to Congress. One idea that outgoing Louisiana Senator Bill Cassidy proposed last week that wouldn’t involve cutting benefits or raising taxes is for the program to borrow $1.5 trillion and invest it in the stock market. A leveraged investment into an 18 year old bull market trading near all-time record valuations—what could go wrong?
It’s impossible to know what will happen to our Social Security benefits, but we do have the ability to model various outcomes within AlphaGlider Planning, our financial modeling software. At this moment I don’t think my clients who are already receiving benefits need to worry too much about a significant reduction for political reasons I mentioned earlier. But that said, it wouldn’t surprise me if Congress rejiggered the COLA formula to grow those benefits more slowly or to tax a greater portion of those benefits than they do now.
I think that those of us in our late 50s and early 60s have a bit more to worry about, but probably not too much more. Perhaps this is hopeful thinking on my part, but by the time Congress finally gets around to fixing the program (in 5-6 years?), we will be eligible to start taking benefits and thus are probably safe from serious benefit reductions.
Some of us may be tempted to start taking Social Security early in fear that the program will run out of money, but I recommend against doing so. There may be other reasons to take benefits early, but I don’t think this is one of them. I suspect Congress will treat all people of a particular age similarly when it does act, regardless of whether they elected to take benefits early or late. Starting benefits at 62, the earliest age possible, reduces one’s benefit by 30% relative to starting at the FRA of 67, and 45% relative to starting at the latest possible age of 70. If you think there’s a decent chance that you’ll live past your early 80s, then you could be making a big mistake taking benefits early, locking in a much lower benefit for decades that will likely be reduced just as much as the higher benefit of those waited longer to start taking benefits. Taking benefits early also reduces the “tax planning window” during which many of us should be doing Roth conversions—a whole other topic that I wrote about last year.
I think my younger clients, those in their 30s and 40s, should expect to bear the brunt of any Congressional changes to fix the Social Security program. There will still be benefits for them in retirement, but they will likely face higher payroll taxes during the rest of their working career and a later start date for their benefits. While we are modeling in a 15-20% reduction in Social Security benefits in the financial models of my clients in their late 50s and early 60s, we are using 25% reductions for those in their 40s, and 30% reductions for those in the 30s. In actuality, I think there will be a combination of benefit reduction and tax increases, but their combined effect will be conservatively in the ballpark of the reductions we are modeling for our clients. I told you the Trustees’ report made for difficult reading, but with proper financial planning and execution, we can compensate for anything the Trustees throw at us.
NOTES & DISCLOSURES
1This material represents an assessment of the market and economic environment at a specific point in time and is not intended to be a forecast of future events, or a guarantee of future results. Forward-looking statements are subject to certain risks and uncertainties. Actual results, performance or achievements may differ materially from those expressed or implied. Information is based on data gathered from what we believe are reliable sources. It is not guaranteed as to accuracy, does not purport to be complete, and is not intended to be used as a primary basis for investment decisions. It should also not be construed as advice meeting the particular investment needs of any investor.
2Mutual funds, exchange-traded funds and exchange-traded notes are sold by prospectus. Please consider the investment objectives, risks, charges, and expenses carefully before investing. The prospectus, which contains this and other information about the investment company, can be obtained directly from the Fund Company or your financial professional. Be sure to read the prospectus carefully before deciding whether to invest.
3Alternative investments, including hedge funds, commodities and managed futures involve a high degree of risk, often engage in leveraging and other speculative investments practices that may increase risk of investment loss, can be highly illiquid, are not required to provide periodic pricing or valuation information to investors, may involve complex tax structures and delays in distributing important tax information, are subject to the same regulatory requirements as mutual funds, often charge higher fees which may offset any trading profits, and in many cases the underlying investments are not transparent and are known only to the investment manager. The performance of alternative investments including hedge funds and managed futures can be volatile. Often, hedge funds or managed futures account managers have total trading authority over their funds or accounts; the use of a single advisor applying generally similar trading programs could mean lack of diversification and, consequently, higher risk. There is often no secondary market for an investor’s interest in alternative investments, including hedge funds and managed futures and none is expected to develop. There may be restrictions on transferring interests in any alternative investment. Alternative investment products including hedge funds and managed futures often execute a substantial portion of their trades on non-US exchanges. Investing in foreign markets may entail risks that differ from those associated with investments in the US markets. Additionally, alternative investments including hedge funds and managed futures often entail commodity trading which can involve substantial risk of loss.
4Rebalancing can entail transaction costs and tax consequences that should be considered when determining a rebalancing strategy.
5AlphaGlider LLC does not offer legal or tax advice. Please consult the appropriate professional regarding your individual circumstance.
^Indices are unmanaged and investors cannot invest directly in an index. The performance of indices do not account for any fees, commissions or other expenses that would be incurred.
aThe Standard & Poor's 500 (S&P 500) Index is a free float-adjusted market capitalization weighted index that is designed to measure large cap US equities. The index includes 500 leading companies and captures approximately 80% coverage of available market capitalization in the US equity markets.
bMSCI Europe, Australasia and Far East (EAFE) Index is a free float-adjusted market capitalization weighted index that is designed to measure the investable universe of developed market equities outside of the US.
cMSCI Emerging Markets (EM) Index is a free float-adjusted market capitalization weighted index that is designed to measure large and mid-cap equity market performance in the global Emerging Markets.
dMSCI All-Country World (ACWI) Investable Market Index (IMI) is a free float-adjusted market capitalization weighted index that is designed to measure the investable universe of global equity markets.
eThe Bloomberg Barclays US Aggregate Bond Index is a market capitalization weighted index that is designed to track most investment grade bonds traded in the United States. The index includes Treasury securities, government agency bonds, mortgage-backed bonds, corporate bonds and a small amount of foreign bonds traded in the United States. Municipal bonds and Treasury Inflation-Protected Securities (TIPS) are excluded due to tax treatment issues.
Copyright © 2026 AlphaGlider LLC. All Rights Reserved.
No part of this report may be reproduced in any manner without the express written permission of AlphaGlider LLC.