
Photo by Zlaťáky.cz on Unsplash
INVESTMENT ENVIRONMENT1
Source: Orion Advisor Services, AlphaGlider
Global investment markets were gangbusters for a second straight quarter. China helped emerging market equities lead the way again in the third quarter, with the MSCI Emerging Markets Index^c increasing 10.6%. The US equity market also did well, spurred by continued buying of Artificial Intelligence (AI)-related stocks. The S&P 500 Indexa was up 8% in the quarter. Foreign developed equities, as measured by MSCI EAFE,b were up a healthy 4.8%. Fixed income markets were also strong—our fixed income benchmark, the Bloomberg US Aggregate Index,e was up 2.0% during the quarter.
Over the last 12 months, equity markets were up nicely, in the mid to high double digits across each of the major regions. Weighed down by its long end (duration), fixed income performance disappointed over the last year. Our fixed income benchmark up only 2.9%.
The US economy continues to expand strongly, up 3.8% in the second quarter. However, there are increasing signs that tariffs are serving as a drag, with inflation and unemployment both rising in Q3 readings. The US government shutdown has delayed the release of the September consumer price index (CPI) readings, but we saw the August core (excluding volatile food and energy) CPI register 3.1% year on year, the same as in July. There is cause for concern that inflation could spike from here as many retailers have been slow to raise prices caused by the tariffs. Some retailers are still selling down pre-tariffed inventory while others may have swallowed the tariffs in hope that they would not go into effect or would be quickly removed. As more time goes by and as more tariffs are applied (e.g. 10-50% tariffs on imported furniture, kitchen cabinets, and lumber went into effect on 14 October), we are likely to see inflation tick up. In August, consumers expect US inflation to increase 4.8% over the next year per the University of Michigan survey. This expectation is consistent with private surveys of purchasing managers, which has historically led core CPI by around three months, as shown below. Inflation of 4% or more appear to be around the corner for US consumers.

Source: Torsten Slok/Apollo, AlphaGlider
America’s “low-hire, low-fire” job market persisted in August, as job openings remained steady and layoffs were low, according to Bureau of Labor Statistics data. Nonfarm jobs increased by 22,000, well below economists’ expectations for a modest 80,000 increase. Unemployment rose 0.1% points from July, to 4.3%.

Source: CBS News
Despite the blinking yellow light coming from inflation, the deteriorating jobs picture motivated the Federal Reserve to cut its overnight rate by 25 basis points (bps) last month, its first since December. The market is pricing in two more 25bps cuts by year end from its current 4.0-4.25% range.
We all know that AI companies have driven the US stock market’s strong performance ever since the rollout of ChatGPT in late 2022, but it is now responsible for most of the growth in the US economy. As shown in the chart below, spending on software and IT equipment has always been a major driver of US gross domestic product (GDP) growth. But this year’s software and IT equipment contribution to GDP growth, spurred by the rush into AI, has grown to record levels—higher than during the late 1990s technology bubble. Meanwhile, all other components of the economy, in total, are in decline this year—usually a feature of a recession. Note that this chart excludes residential investment’s impact on GDP, but it too was in decline in the first half of 2025.
Source: BlackRock, AlphaGlider
The chart below shows the past and projected capital expenditures (capex) of the major players in AI, Amazon, Meta (Facebook), Google, Microsoft, and Oracle. Collectively, they are forecast to spend over $400 billion in capex next year, about 5x their spend in 2019.
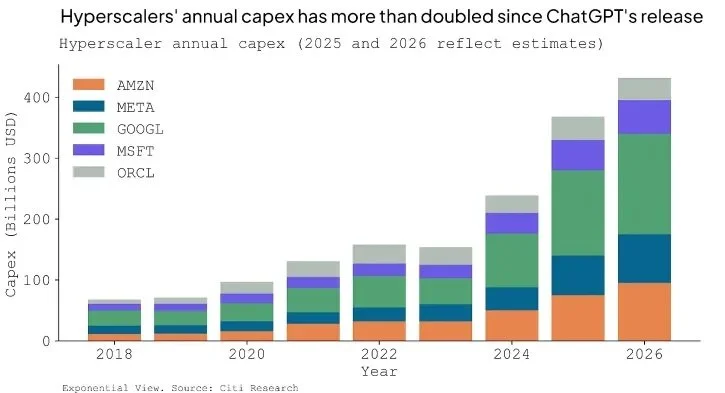
Source: Citi Research
Just as with the Internet in the late 1990s, the potential for AI is undeniably impressive. AI will likely drive significant economic development by boosting productivity and the rate of discovery. However, it is far from clear if the companies on the above chart will be the primary beneficiaries of AI—yet investors appear to be pricing in a high degree of certainty that they will be. The chart to the upper right exemplifies this concern.
At the stock market peak of the late 1990s technology bubble, the 10 largest listed companies in the US had a combined enterprise value (equity plus debt) that was 28.4% of the country’s GDP at the time. All 10 of these companies were Internet plays of one kind or another, be it software, hardware, or services. These companies had all aggressively ramped up their capex spending in the late 1990s, helping accelerate the country’s impressive run GDP growth as we saw on the chart on the previous page. Their investments, as well as their strong revenue growth, were concentrated and intertwined. Then in early 2000, investors called time, and started demanding returns on these companies’ spending. Subsequently, share prices of these companies collapsed and stayed depressed well after the peak. Tough to get an exact reading from the chart, but it looks like these 10 Internet darlings were worth only about 8% of the country’s GDP a full seven years after the peak.
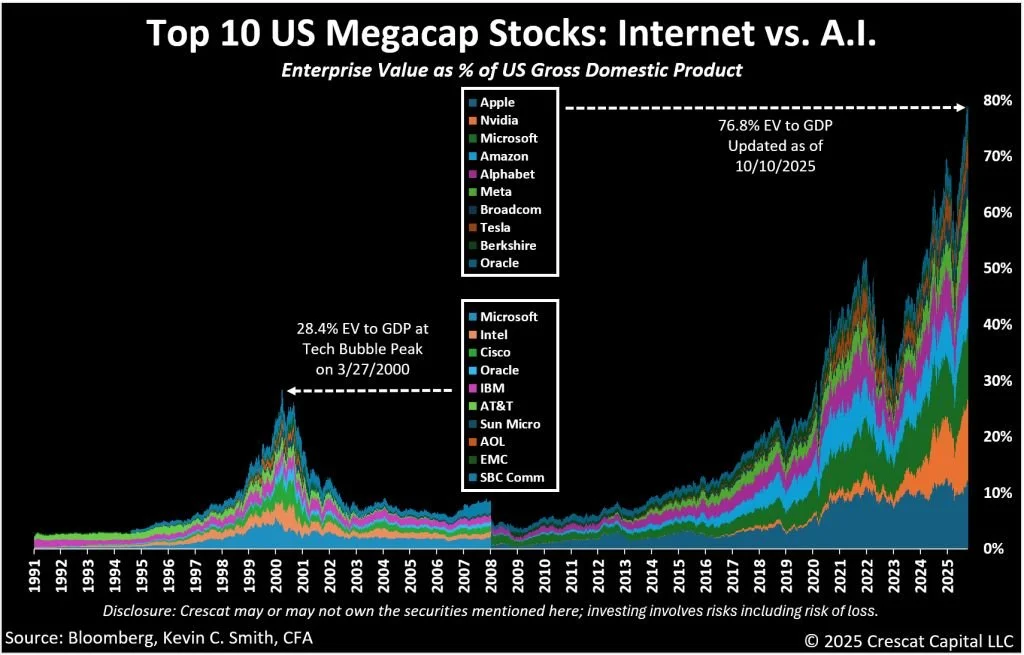
Today’s top 10 list contains only one company from the 2000 list, Microsoft. Nine of the 10 are AI, or expectant AI plays, with Warren Buffett’s Berkshire Hathaway the odd company out. As of the time of this chart, the combined enterprise value of these 10 companies was 76.8% of US GDP, multiples of what it was for the Internet plays in 2000. Granted, some of this can be explained by the expansion of corporate margins over the last 25 years, but only a small part. It’s tough to know how much further this AI bull has to run and how many, if any of these nine AI companies will be in the top 10 in 25 years time, but history implies that there is a lot of risk investing in them at today’s valuations. And since these 10 companies make up about 40% of the S&P 500 (thanks ChatGPT), we believe there is elevated risk in investing in the S&P 500 at this time.
Aside from AI, the other major investment theme during the third quarter was the “dollar debasement” trade. Concerns about a possible resurgence in inflation, the U.S. debt load and structural deficits, and economic and policy uncertainty are driving investors to diversify away from dollar-denominated assets. The two main beneficiaries thus far have been gold and Bitcoin. Since the November election through the end of the third quarter, Bitcoin (BTC) is up 66% against the dollar, and gold (GC1) is up 41%, while the dollar is down 5.4% against a basket of other currencies (DXY).

Source: AlphaGlider, Koyfin
On the global trade front, President Trump continues to tweak tariff rates, mostly upwards. The approximate weighted average of his tariffs, based on 2024 imports, exited the quarter around 19%, a level not reached since the Smoot Hawley tariffs during the 1930s (see chart below). However, effective tariff rates are coming in much lower (11.3% in August) due to US importers shift sourcing to lower tariffed countries and to domestic suppliers, and possibly due to various implementation frictions (legacy exemptions, delays in customs system updates, ongoing litigation on which goods could be subject to tariffs, other mechanisms preventing full tariff implementation).
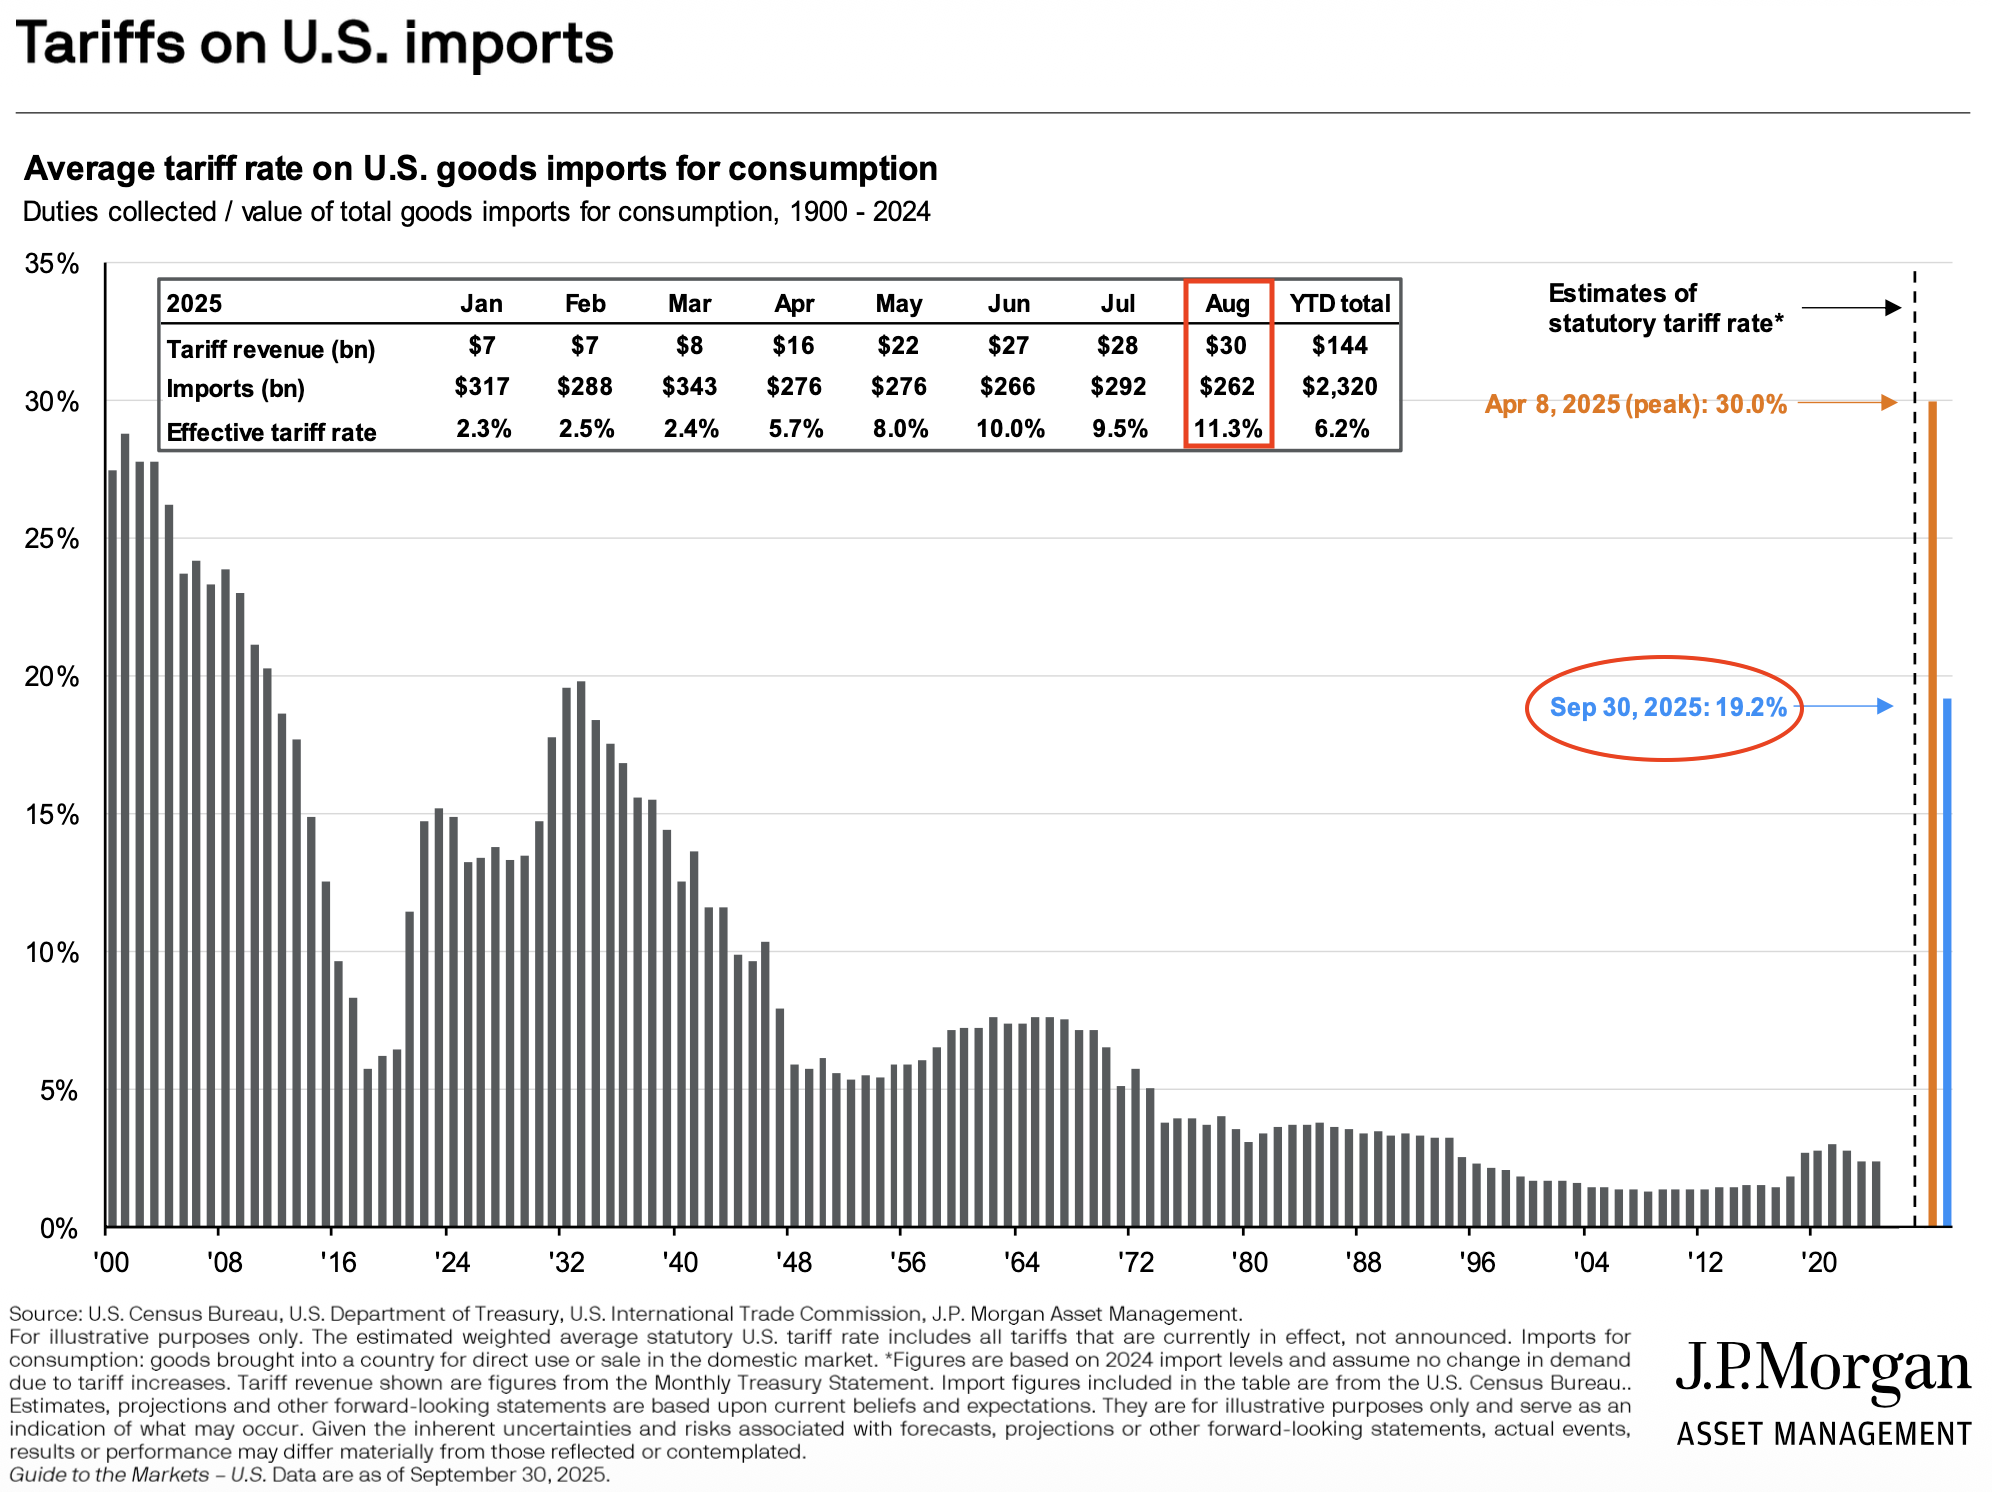
Source: JP Morgan Asset Management
In August, a federal appeals court ruled that President Trump’s tariffs enacted by the International Emergency Economic Powers Act (IEEPA) are illegal, but held off enforcing the decision in expectation that the Supreme Court will hear an appeal to its decision in November. Even if the Supreme Court ultimately rules against Trump, many expect Trump will reapply the tariffs through other authorities available to him.
Continuing with tariffs, trade negotiations between China and the US continue to be contentious. Every time Trump threatens to raise tariffs against China, President Xi Jinping orders export controls of vital rare earth minerals, and magnets and motors that include these minerals—including this past week. This has led to two 90-day tariff truces, the current one expiring on 10 November. Market reaction to the ups and downs of the trade negotiations between the two largest economies in the world has been muted, with "TACO traders" quickly buying at the slightest dip in trade-sensitive asset prices.
PERFORMANCE DISCUSSION
Third Quarter
AlphaGlider’s strategies returned between 85 and 90% of their respective benchmarks during another full risk-on quarter. The main drag on our strategies’ performance was their large underweight exposure to US large cap growth and technology equities which continued to outperform. Our strategies were also held back by their overweighting to developed foreign equities and shorter duration US bonds—both of which performed well in absolute terms, yet lagged the overall global markets. And with the small rebound in the dollar, our unhedged foreign bonds detracted from our performance.
On the positive side, our strategies benefited from their large overweighting of emerging market equities and bonds. Our commodities and market neutral equity funds also contributed positively to our performance.
Our ESG strategies slightly underperformed their Core strategy counterparts, despite strong performance from clean energy equities.
Last 12 Months
AlphaGlider strategies matched between 80 and 95% of the performance of their respective benchmarks on average over the last 12 month period. Our ESG strategies slightly underperformed our Core strategies during this period.
As in the third quarter, our strategies underweighting of US large cap growth and technology equities held back our strategies’ relative performance over the last year. Also hurting performance was our overweighting of US value, quality, small cap, and mid cap US equities.
Outside of our overweight position in emerging market stocks, most of our winners over the last year came from fixed income and alternative investments. Specifically, we benefitted from our overweighting toward short duration US bonds, inflation-protected Treasuries, and emerging market bonds. Among alternative investments, our market neutral equity fund and general commodities fund performed well.
LOOKING FORWARD

Last quarter in this section I announced that AlphaGlider began using new, powerful financial planning software we call AlphaGlider Planning. Now that we have many of our clients up and running on it, I wanted to highlight one specific tax planning strategy that it is beneficial for many AlphaGlider clients—Roth conversions.
A Roth conversion is the process of moving money from a traditional pre-tax retirement account—such as a traditional Individual Retirement Account (IRA) or 401(k)—into a Roth IRA. When you convert, the amount transferred is treated as taxable income in the year of conversion. The key benefit is that once the funds are in a Roth IRA, all future growth and withdrawals (if taken after age 59½ and meeting the five-year holding period) are tax-free. In essence, you are choosing to pay taxes today to avoid higher taxes on future withdrawals.
Another Roth benefit is that there are no required minimum distributions (RMDs) as there are for traditional pre-tax retirement accounts. A Roth IRA is also substantially more valuable to a non-spouse beneficiary than is a similarly sized traditional pre-tax retirement account—not only because Roth distributions are tax-free, but also because your beneficiary can let the full amount of the Roth grow tax free for 10 years before taking the tax-free distribution. While inherited traditional pre-tax retirement accounts also do not have to be emptied for 10 years, it usually makes sense for the beneficiary to make annual distributions over the 10-year period so as to avoid being pushing up into a higher marginal tax bracket in any one year—losing some of the tax-deferred benefits of the account.
A Roth conversion tends to make the most sense when your current marginal combined federal and state tax rate is lower than your expected future tax rate. If you expect to face higher tax rates down the road, paying taxes now at today's lower rates can result in significant long-term savings. This scenario commonly arises in several situations. For instance, someone who has recently retired but has not yet begun taking Social Security or RMDs may find themselves temporarily in a lower tax bracket. Those years—often called the “tax planning window”—present a prime opportunity to convert funds at relatively low tax rates. Similarly, if you currently reside in a low-tax state but plan to move to a state with higher income taxes, converting before the move allows you to pay taxes at a lower tax rate. Another case arises when you anticipate that tax rates in general will rise over time—whether due to fiscal pressures, political changes, or expiring tax provisions—making it advantageous to “lock in” today’s lower rates. Roth conversions can also make a lot of sense after a big drop in the markets. Taxes due on the conversion will be lower, and the eventual rebound in prices will never be taxed.
However, Roth conversions come with important financial and tax implications that must be considered carefully. One key factor is that you need non-retirement (i.e. taxable) assets available to pay the taxes due on the conversion. Using funds from the retirement account itself to cover the tax bill will reduce the long-term benefit of the strategy and, if you’re under 59½, may even trigger penalties. Additionally, increasing your adjusted gross income (AGI) through a Roth conversion can push you into higher income thresholds that may negatively affect other areas of your financial life. For example, a higher AGI can result in increased Medicare Part B and D premiums (known as IRMAA surcharges), push realized long-term capital gains into higher tax brackets, reduce eligibility for income-based credits, deductions, and subsidies such as those under the Affordable Care Act, reduce the new “senior bonus deduction” introduced by the One Big Beautiful Bill Act (OBBBA), and negatively impact one’s eligibility for federal education financial aid programs.
Because of these nuances, Roth conversions should be viewed as part of a long-term tax management strategy, not just a one-time transaction. Thoughtful modeling of your current and projected future tax situation—along with consideration of state taxes, investment horizons, and estate goals—can help determine whether a conversion provides meaningful after-tax benefits. The analysis is too complex for back of the envelope calculations or Roth conversion calculators you may find on the Internet. With AlphaGlider Planning, we now have the modeling software to identify Roth conversion opportunities. Once identified, we ask that our clients review the model’s findings with their tax advisor to confirm if a Roth conversion is right for them.5
Let’s now take a look at how AlphaGlider Planning conducts a Roth conversion analysis for a hypothetical couple, John and Jane Smith. They are both 60 years old, and they plan to retire in two years. They currently have $100k in cash and $3m in investments, of which $1.5m is in a joint taxable account ($1m cost basis), $1.3m in their various 401(k)s and traditional IRAs (the amount available to be converted to Roths), and $200k in their Roth IRAs. These investments are in a 60/40 equity/fixed income portfolio, with the equity and fixed income investments fairly equally distributed across account types. They plan to delay starting Social Security until they each reach 70, which AlphaGlider Planning determined would maximize their lifetime payments if they both live until age 95. The Smiths currently live in Texas but anticipate moving to California in six years to be closer to their two children and their partners, and they hope some grandchildren by that time.
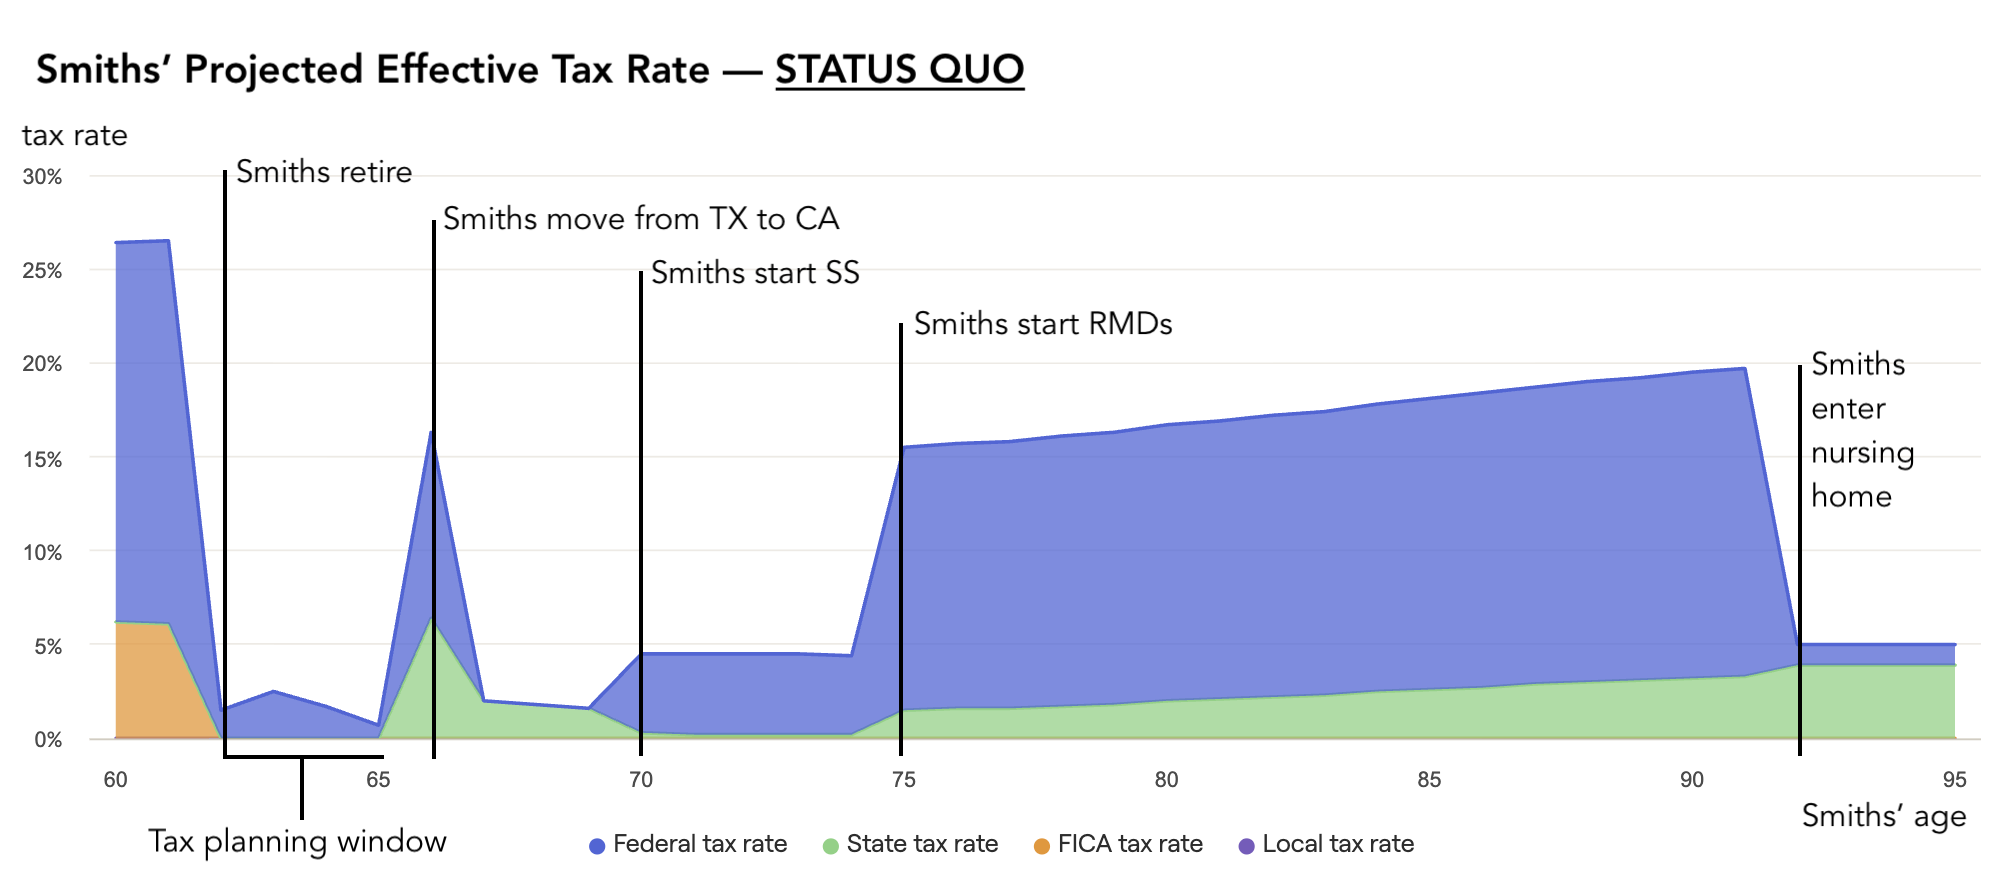
Once the Smiths retire in 2027 at age 62 but before they move to California in 2031, they will be in the “tax planning window”, when they will temporarily enjoy a low tax bracket. In 2027, their AGI is expected to fall to less than $50,000 (their only taxable income will come from interest, dividends, and realized capital gains from their taxable investments), putting them into the low 10% marginal federal tax bracket. While living in Texas, they are not exposed state income tax. But they will start to incur state taxes when they move to California at age 67, and their income will increase when they start Social Security at age 70 and then again at age 75 when they are both forced to take RMDs from their traditional (pre-tax) retirement accounts. The chart below shows the Smith’s projected effective combined tax rate between now and age 95, the end of the planning period.
Source: AlphaGlider with data from RightCapital
The chart shows the dramatic drop-off in the Smiths’ effective tax rate when they retire at 62, and the progressive increase in that rate as they relocate to California (age 65), start Social Security (70), and start RMDs (75). The temporary spike in their effective tax rate at 65 is due to paying capital gains taxes to generate funds to buy a home in California’s more expensive real estate market, and the decline in that rate near their end of life is due to federal deductibility of nursing home expenses.
AlphaGlider Planning projects that the Smiths’ investments will grow to ~$6.75m by the end of the plan, $2.71m of which will be in tax-deferred accounts that will eventually be taxed after being inherited by the Smiths’ California-based children. Assuming these tax-deferred accounts face a 30% combined federal and state tax when the children take distributions, the after-tax value of these investments will be reduced to ~$5.93m.
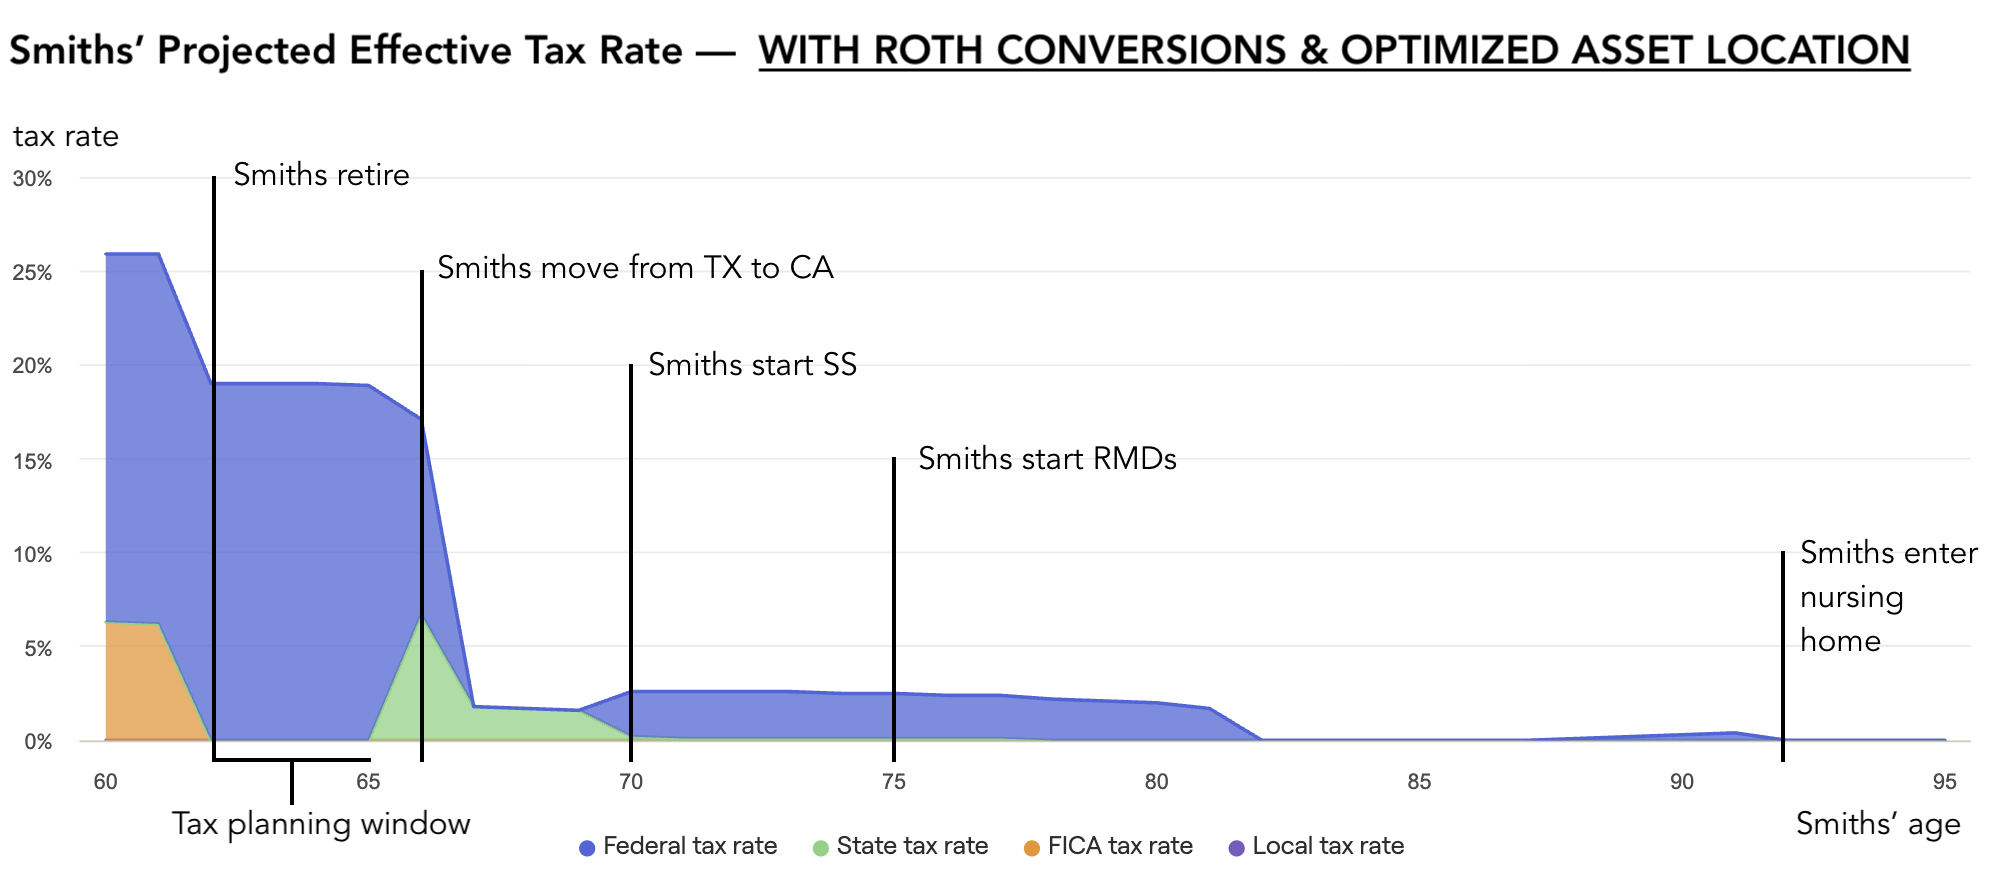
Now let’s look at the Smiths’ situation if they follow AlphaGlider Planning’s two tax planning recommendations: 1) make annual Roth conversions in the first four years of their retirement, up to the amount that fills their 22% federal tax bracket, and 2) tax optimize the location of their investment assets (prioritized equities in taxable and tax-free (i.e. Roth) accounts, fixed income in tax-deferred (i.e. Traditional retirement) accounts. As the chart below shows, the Smith’s projected effective combined tax rate will increase from low single digits to approximately 19% during the four years of Roth conversions, but will then fall from the upper teens into the low single digits throughout most of their retirement years. The model projects that the Smiths will actually pay little to no California state tax from age 70.
Source: AlphaGlider with data from RightCapital
As shown on the following chart, the model projects that the Smiths’ investments will grow to ~$6.95m by the end of the plan with the Roth conversions and tax optimized asset location, and 100% of these assets will be tax free to their heirs. This is a significant $1.02m improvement (17%) in the after-tax value of their investments at then end of the plan. Approximately 70% of this improvement comes from Roth conversions with the balance coming from tax optimized asset location.

Source: AlphaGlider with data from RightCapital
In performing this analysis, AlphaGlider Planning assumes static capital market investment returns over the entire period of the plan. But if there’s one thing we know for certain it is that investments returns will be wildly variable from year to year, and on average could deviate significantly from our assumed returns, either better or worse. Just as it is beneficial to make a Roth conversion after a big drop in the market, it can be painful to make one just before a big drop in the market. Therefore, it is always important to review AlphaGlider Planning’s Monte Carlo simulations to determine if the recommended Roth conversions have a negative impact on probabilities of running out of investments before the end of the plan. In the reference strategy, AlphaGlider Planning estimates that there is a 12% chance that the Smiths will deplete their investments before the end of the plan—the same chance it models with Roth conversions and tax optimized asset location. Put simply, we do not expect the two tax planning recommendations to meaningfully change the Smiths’ risk of running out of investment funds in retirement.
The benefit of Roth conversions to the Smiths could be even larger if tax rates go up in the future, a scenario we believe to be highly likely. The current financial picture of the federal government is concerning, with the recently completed fiscal 2025 deficit hitting nearly $2 trillion—pushing the federal debt held by the public over $30 trillion (~100% of GDP). As shown in the chart below, the US raised only 70 cents for every dollar it spent during a robust year of growth. Spending is set to only increase going forward as four of the government’s top five spending categories will continue to increase due to the country’s aging demographics, rising debt and elevated interest rates, and renewed prioritization of the military. The current administration had said that its Department of Government Efficiency (DOGE) could cut trillions from the annual budget, but that initiative appears to have failed miserably. Controlling deficits through the revenue side also look hopeless after passage of the OBBBA. Trump’s tariffs (customs duties in the chart) are starting to generate significant revenue, but at ~$200 billion per year going forward (+/- $50 billion), they only cover about 3% of last year’s spending. That is why most reputable forecasts of the annual deficit have it progressively increasing from its current $2 trillion level to over $3 trillion in 10 years.

Source: US Treasury, AlphaGlider
In this scenario, bond investors will eventually force the US to face its debt problem by demanding higher interest rates on the money they loan to the US. When this happens, we think that politicians will be forced to raise today’s historically low tax rates for individuals and corporates. Roth conversions are a good hedge against this eventuality, as you pay tax at today’s low rates to avoid paying tax at tomorrow’s higher rates. If we assume that federal tax rates increase by just two percentage points across each tax bracket starting in six years time, the benefit of the Smiths’ Roth conversions jumps to $1.24m (+22%), up from $1.02m (+17%) in the case we assume no tax rate increase.
So much about retirement planning revolves around tradeoffs of risk and reward in your investments. If you want more money in retirement, you need to take more investment risk. But the beauty of the tax planning component of retirement planning is that it is usually a way to increase your expected spending power without taking on more risk. Roth conversions, as well as other tax planning techniques such as tax optimized asset location and tax loss harvesting, usually fit this bill.
NOTES & DISCLOSURES
1This material represents an assessment of the market and economic environment at a specific point in time and is not intended to be a forecast of future events, or a guarantee of future results. Forward-looking statements are subject to certain risks and uncertainties. Actual results, performance or achievements may differ materially from those expressed or implied. Information is based on data gathered from what we believe are reliable sources. It is not guaranteed as to accuracy, does not purport to be complete, and is not intended to be used as a primary basis for investment decisions. It should also not be construed as advice meeting the particular investment needs of any investor.
2Mutual funds, exchange-traded funds and exchange-traded notes are sold by prospectus. Please consider the investment objectives, risks, charges, and expenses carefully before investing. The prospectus, which contains this and other information about the investment company, can be obtained directly from the Fund Company or your financial professional. Be sure to read the prospectus carefully before deciding whether to invest.
3Alternative investments, including hedge funds, commodities and managed futures involve a high degree of risk, often engage in leveraging and other speculative investments practices that may increase risk of investment loss, can be highly illiquid, are not required to provide periodic pricing or valuation information to investors, may involve complex tax structures and delays in distributing important tax information, are subject to the same regulatory requirements as mutual funds, often charge higher fees which may offset any trading profits, and in many cases the underlying investments are not transparent and are known only to the investment manager. The performance of alternative investments including hedge funds and managed futures can be volatile. Often, hedge funds or managed futures account managers have total trading authority over their funds or accounts; the use of a single advisor applying generally similar trading programs could mean lack of diversification and, consequently, higher risk. There is often no secondary market for an investor’s interest in alternative investments, including hedge funds and managed futures and none is expected to develop. There may be restrictions on transferring interests in any alternative investment. Alternative investment products including hedge funds and managed futures often execute a substantial portion of their trades on non-US exchanges. Investing in foreign markets may entail risks that differ from those associated with investments in the US markets. Additionally, alternative investments including hedge funds and managed futures often entail commodity trading which can involve substantial risk of loss.
4Rebalancing can entail transaction costs and tax consequences that should be considered when determining a rebalancing strategy.
5AlphaGlider LLC does not offer legal or tax advice. Please consult the appropriate professional regarding your individual circumstance.
^Indices are unmanaged and investors cannot invest directly in an index. The performance of indices do not account for any fees, commissions or other expenses that would be incurred.
aThe Standard & Poor's 500 (S&P 500) Index is a free float-adjusted market capitalization weighted index that is designed to measure large cap US equities. The index includes 500 leading companies and captures approximately 80% coverage of available market capitalization in the US equity markets.
bMSCI Europe, Australasia and Far East (EAFE) Index is a free float-adjusted market capitalization weighted index that is designed to measure the investable universe of developed market equities outside of the US.
cMSCI Emerging Markets (EM) Index is a free float-adjusted market capitalization weighted index that is designed to measure large and mid-cap equity market performance in the global Emerging Markets.
dMSCI All-Country World (ACWI) Investable Market Index (IMI) is a free float-adjusted market capitalization weighted index that is designed to measure the investable universe of global equity markets.
eThe Bloomberg Barclays US Aggregate Bond Index is a market capitalization weighted index that is designed to track most investment grade bonds traded in the United States. The index includes Treasury securities, government agency bonds, mortgage-backed bonds, corporate bonds and a small amount of foreign bonds traded in the United States. Municipal bonds and Treasury Inflation-Protected Securities (TIPS) are excluded due to tax treatment issues.
Copyright © 2025 AlphaGlider LLC. All Rights Reserved.
No part of this report may be reproduced in any manner without the express written permission of AlphaGlider LLC.