
Photo by Frankie Lopez on Unsplash
INVESTMENT ENVIRONMENT1
Source: Orion Advisor Services, AlphaGlider
The second quarter got off to a shaky start, when President Trump announced his extremely high and randomly derived "reciprocal" tariffs against nearly all countries and even a group of islands inhabited only by penguins. However within hours of the tariffs going into effect on 9 April, and equity and bond markets collapsing, Trump paused the tariffs for 90 days, giving a green light for buy-the-dip investors to re-enter the pool. Equity markets throughout the world posted strong gains during the quarter, with the US equity market, as measured by the S&P 500,^a increasing 10.8%. Foreign equity markets performed even better, with developed markets posting an 11.8% gain and emerging markets up 12.0%, as measured by MSCI EAFEb and MSCI Emerging Markets,c respectively. Fixed income markets were mixed—our fixed income benchmark, the Bloomberg US Aggregate Index,e was up 1.2% during the quarter.
Global equity markets also put up strong, mid-teens returns over the last 12 months, again led by foreign equities. Fixed income also did well, with our fixed income benchmark up over 6%.
The bullish turn in the equity markets appears to have several explanations. The first being that investors around the world have grown to believe that Trump will ultimately back down from his tariff threats if they prove too economically disruptive—the “TACO” trade, short for “Trump Always Chickens Out.” When global stocks and US bonds went into free-fall on the day Trump’s "reciprocal" tariffs went into effect, Trump quickly reversed course because investors “were getting a little bit nippy, a little bit afraid.” Trump went on to make many more tariff threats, each drawing less and less investor reaction, as he was quick to delay or reverse many of them—most recently he pushed back the resumption of his "reciprocal" tariffs, this time from 9 July to 1 August.
Source: Bloomberg
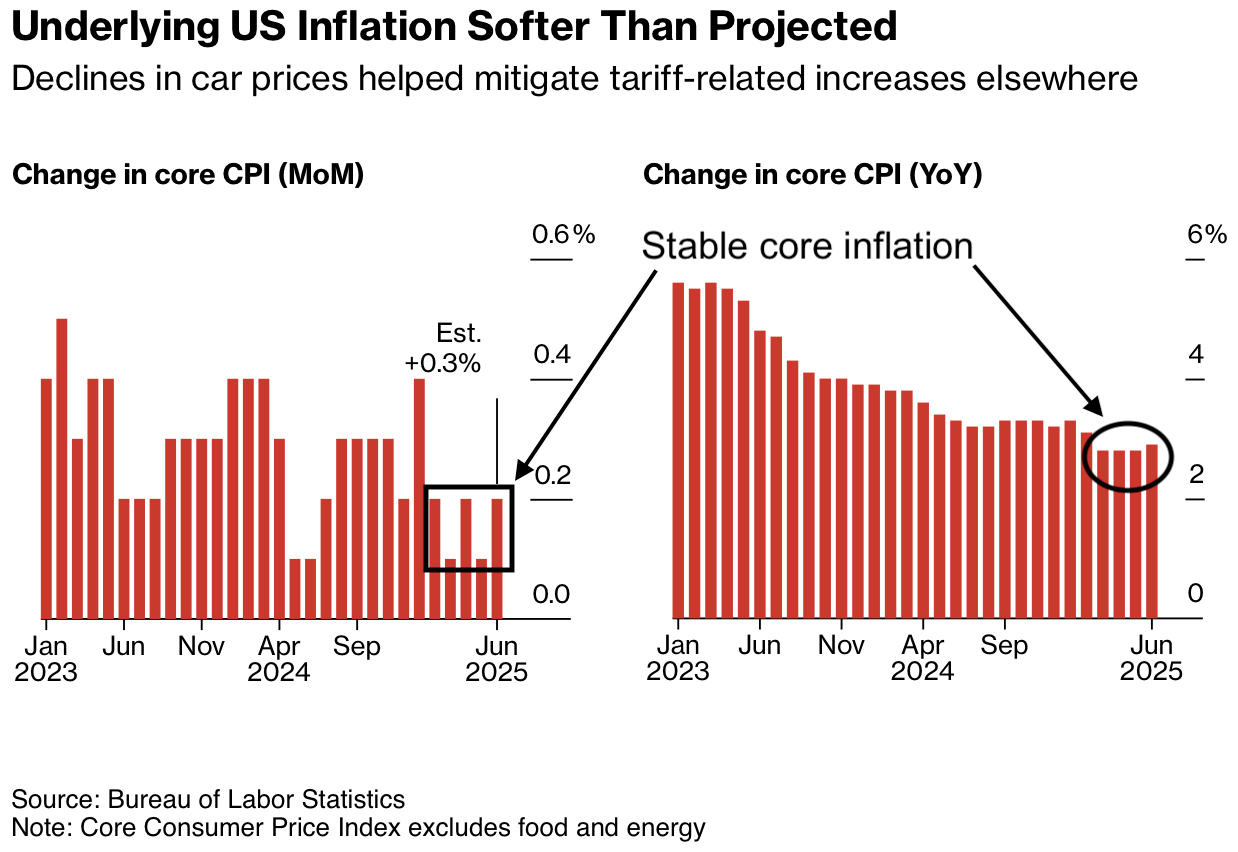
Another reason for the rebound in equity market has been the weaker than expected inflation readings in the US during the second quarter—despite some of Trump’s tariffs actually sticking, such as the 55% combined tariffs on China, the 10% base tariff on most other countries, 25% tariffs on imported autos and auto parts, and the 50% tariffs on steel and aluminum. As the chart on the left shows, the core consumer price index (CPI), which strips out volatile energy and food prices, has been stable at 2.8-2.9% higher year-on-year over the last four months.

The White House has advocated that these stable inflation readings as one reason for the Federal Reserve (Fed) to cut interest rates. However, most economists still expect inflation to rise in the second half as the impact of the tariffs increasingly filter through the economy. One likely reason for the delayed impact of tariffs on inflation is that goods imports surged into the US during the first quarter ahead the anticipated "reciprocal" tariffs. It may take a few months for this pre-tariff inventory to sell down, after which time US consumers will no longer be shielded from the effects of the tariffs.

Another potential reason for the stable inflation readings is that some foreign exporters and domestic retailers may have eaten the tariffs in their own TACO trade. For example, Japanese auto makers dropped prices on their exported vehicles bound for the US by nearly 20% to offset the 25% tariff that Trump applied on them on 3 April, as shown above. As the Japanese auto makers likely did not have a 20% profit margin on most of these vehicles before the tariffs, it would appear that they lowered their prices temporarily to remain in the market, in hope that Trump would soon remove some or all of the tariffs. Japanese auto makers probably saw the alternative option, to immediately raise prices in response to the tariffs, as unattractive as they believe there is a strong chance they would need to lower them a short time later because, you know, TACO.
Also, I imagine they did not want to illicit unwanted attention from Trump for raising prices, as Jeff Bezos found out when Trump learned that Amazon had plans to break out tariff charges on certain items to its customers. But Japanese auto makers, like all other exporters, won’t sell their goods to the US at a loss indefinitely. And when price increases finally do begin to show up in the hard data, companies will have more cover to raise prices without fear of losing market share or provoking the ire of the White House.
A third reason that stocks did well in the second quarter was that the US economy continues to perform well. Although new hiring remains sluggish, layoffs are low as is unemployment, 4.1% in June. Wages continue to comfortably outpace inflation, and consumers continue to spend, especially wealthier ones who are flush with recent stock market gains.

Source: The New York Times
A fourth reason for the buoyant equity market was the passage of the Republican’s business-friendly One Big Beautiful Bill Act (OBBBA). Forecast to add over $3 trillion to the federal debt over the next decade versus the tax law it replaces, it is stimulative to the economy in the short term. The bill benefits companies and the rich via lower taxes, paid in part by drastic reductions in health care (Medicaid and Affordable Care Act, or ACA) and food security (Supplemental Nutrition Assistance Program, or SNAP) coverage for the poor as shown in the chart above. The Congressional Budget Office (CBO) estimates that 17 million Americans will lose health insurance over the next decade as a result of the OBBBA, while the Urban Institute forecasts that the bill will cause over 22 million American families to lose some or all of their food assistance. Read more about the bill’s potential impact on you in the Looking Forward section further down in this piece.
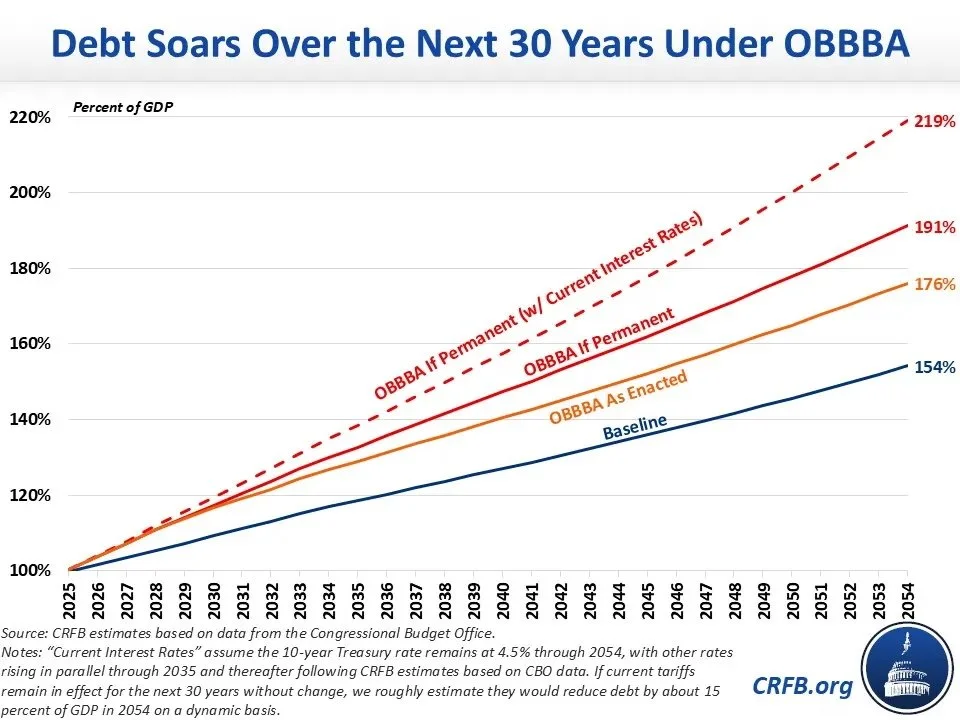
Moving on, but remaining on the topic the OBBBA, the structural budget deficits that the bill locks in are causing renewed concern about future growth rates of the US economy and the strength of the US dollar. In their 2012 seminal paper entitled “Public Debt Overhangs: Advanced Economy Episodes Since 1800,” Carmen Reinhart, Vincent Reinhart, and Kenneth Rogoff found that advanced economies with public debt to gross domestic product (GDP) in excess of 90% experienced annualized economic growth that was on average 1.2% lower than in other periods. At $29 trillion, the US federal debt held by the public as a share of GDP currently stands at approximately 100%, a level only exceeded for a few years after the end of World War II. The OBBBA could push the public debt to GDP ratio to between 130 and 140% over the next 10 years (see below), depending on the evolution of interest rates and if future politicians make the temporary provisions of the OBBBA permanent like the Republican just did with the temporary provisions of the 2017 Tax Cuts and Jobs Act (TCJA).
Why are high debt levels correlated with lower future economic growth? Well, the reasons are many, but here are a few mechanisms that cause it:

- As debt increases, so does the interest due on that debt, ceteris paribus. And what is spent on interest simply cannot be spent on economically productive government spending, such as infrastructure. With the recent spike in interest rates and the surge in debt levels over the last 20 years, the federal government now spends more on interest than it does on its military or on Medicare. And as the chart above shows, the US government spends more of its revenue (i.e. tax collections) on interest payments than any other advanced country.
- The US’s high and rising government debt levels crowd out private investment, slowing growth in the private sector. The US government is in competition with the private sector for funding, and thus what goes to funding ever increasing US deficits through the purchase of US Treasuries is not available to American companies issuing bonds and American consumers taking out car loans and home mortgages. And the funding that both the US government and the private sector do get will be at higher interest rates because of the laws of supply (lenders are finite) and demand (growing) of funding. Naturally, rising interest rates serve as a drag on economic growth.
- Another force driving up interest rates is that the US’s high and rising government debt increasingly erodes faith in its credit worthiness. It’s just riskier to lend to a highly indebted entity, so a lender naturally demands a higher interest rate do so. Moody’s Ratings highlighted this risk when it became the last major ratings agency to remove its highest AAA rating from the US government (Fitch lowered in 2023, S&P in 2011). While few expect the US government to default on its obligations any time soon due to its role as the world’s reserve currency and its ability to raise revenue through taxes, lenders do have other options and will increasingly go to them if US debt continues to expand on its current trajectory.
- The US’s high and rising government debt levels increasingly leaves the US economy more vulnerable to future events that would benefit from fiscal stimulus (i.e. recession, pandemic, climate change adaption, hot and cold wars). Future economic downturns in the US could be deeper and longer as a result.
Concern over the US debt position can be seen in the rise in the 30-year Treasury rate which has more than doubled since before the pandemic, to just over 5%. This level has not been seen since 2007, just ahead of the global financial crisis. Rates for the 30-year, along with the 10-year Treasury (running at ~4.5%, more than double its pre-Covid level), are key to the economy as they serve as the benchmark for longer term loans made to the private sector, such as home mortgages, car loans, business loans, and corporate bonds. For years economists have been forecasting a US recession due to the shock from these higher rates, but it has not happened. Yet.
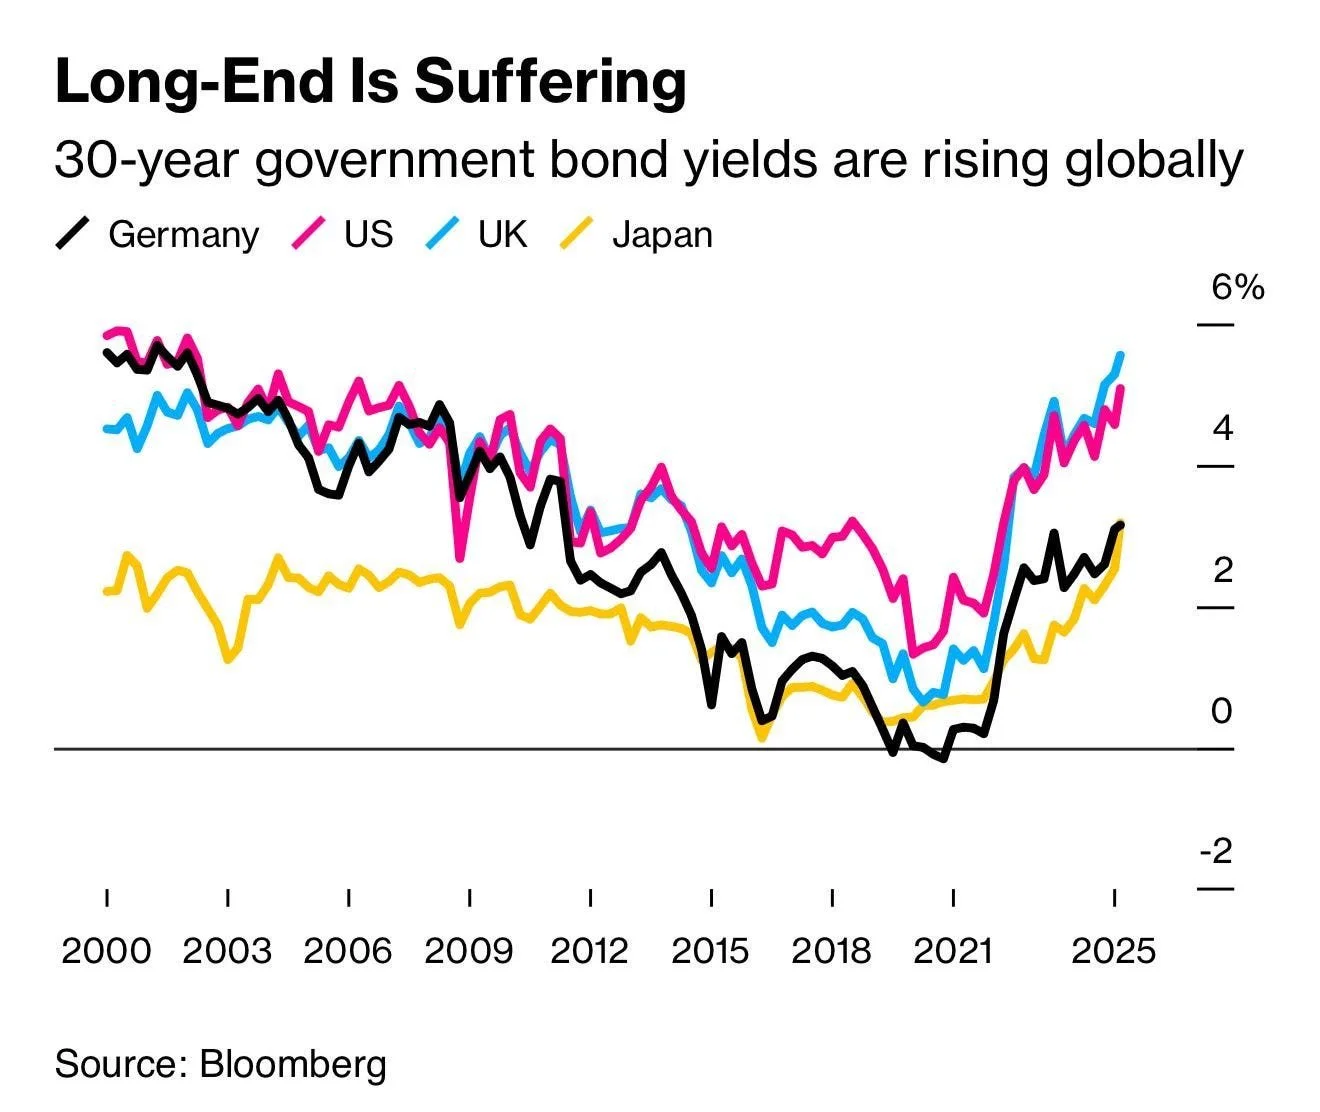
Although the US government spends more of its revenue on servicing its debt, it is hardly the only advanced country suffering from high debt levels, rising deficits, and higher long term rates. The chart on the left shows that other major advanced economies are also facing economic headwinds caused by higher longer term rates.
For Europe and Canada, these higher government borrowing costs land at the same time that their spending is expanding to quickly re-arm to face the rising Russian threat. During the quarter, all members of the North Atlantic Treaty Organization (NATO), with the exception of the US, pledged to raise defense related spending to 5% of GDP by 2035, up from their previous 2% of GDP goal. The US, which spends more on its military than the next nine countries combined in absolute terms, spends about 3% of its GDP on military—and is forecast to decline slowly over the next 10 years.
Japan also faces pressure to raise spending on its military, in response to China’s aggressive militarization efforts. However, it is the prospect of paying significantly higher interest rates on its massive debt load that has investors worried. Japan’s government debt stood at 216% of GDP exiting 2024, down from its peak of 225% in 2022.
One geopolitical situation that we are following especially closely is that of the Iranian nuclear program. Having neutralized most of Iran’s air defenses in October of last year, Israel bombed Iran’s nuclear infrastructure and scientists over 12 days in June. On the ninth day of this campaign, the US joined in by dropping 14 “bunker buster” bombs on two of Iran’s most protected and sensitive nuclear facilities, Fordow and Natanz. The damage to Iran’s nuclear program is still unclear, but it appears that Iran’s 400kg stockpile of near-bomb-grade (60% purity) fuel was not destroyed by either the Israelis or Americans. Iran expelled the United Nations nuclear inspectors from the country in early July, leaving the world blind to any Iranian efforts to rush to make a nuclear bomb. Depending on the degree of damage inflicted by the Israeli and American attacks on Iran’s nuclear facilities, experts believe that Iran has the ability to develop a basic nuclear weapon in a month to as long as a few years.
PERFORMANCE DISCUSSION
Second Quarter
AlphaGlider’s conservatively positioned strategies returned about 90% of their respective benchmarks during a full risk-on quarter. The main drag on our strategies’ performance was their large underweight exposure to US large cap growth and technology equities which rebounded strongly during the quarter. Our strategies were also held back by their overweighting to US quality, value, small cap, and mid cap equities, all of which performed well in absolute terms, yet lagged the overall US equity market. Our strategies were also hurt by their exposure to commodities and inflation-protected Treasury securities, both categories which are not represented in our benchmarks.
Our strategies benefited from their large overweighting of foreign equities, both developed and emerging. This was especially the case for South Korean equities in which we had over double the benchmark weighting. South Korea had one of the best performing stock markets in the world in the quarter, up over 30% in US dollar terms. Our recent move to underweight the Chinese equity market (see next section) also paid off as it was up only slightly during the quarter.
Our fixed income investments continued to be a positive contributor to our strategies’ relative performance. Specifically, our skew to shorter duration bonds and to international bonds were beneficial. Our recent diversification into unhedged international bonds (i.e. no currency hedging; see next section) was especially rewarding given the decline in the US dollar. Our market neutral equity fund also solidly bested its benchmark, cash, during the quarter.
Our ESG strategies performed in line with their Core strategy counterparts, despite the weakness in fossil fuel stocks and the strength in clean energy stocks.
Last 12 Months
AlphaGlider strategies generally performed in line with their respective benchmarks over the last 12 month period. Our ESG strategies slightly underperformed our Core strategies during this period.
Our strategies benefitted from their large overweighting of foreign developed market equities and US mid cap equities over the last 12 months. Although we were underweight Chinese equities in the most recent quarter, we were overweight them over the duration of the last year, which also helped our relative performance. As in the second quarter, our unhedged international as well as the overall short duration of our fixed income portfolio benefitted our strategies.
On the negative side, our underweighting in US growth stocks, and our overweighting in US value and small cap stocks dragged down performance.
LOOKING FORWARD
Trading During the Last Quarter
We saw glimpses of panic in the markets on the morning of April 9th, the day Trump's "reciprocal" tariffs went into effect. Falling global stock markets were to be expected, but the concurrent collapse in long-term US Treasuries and the US dollar were not. These latter two assets almost always act as safe havens that investors duck into when global stocks are hit — but not this time. Now the havoc was coming from within the usual source of global stability, the US. It was clear to us that global investors were losing confidence in the US. Although US stocks and the US dollar had fallen significantly since inauguration day, both continued to trade at significant premiums to their global peers and to their own historical ranges—and thus had significant room to fall further should the uncertainty around tariffs continue.
While Trump paused most of his "reciprocal" tariffs for 90 days within hours of the markets’ precipitous decline, he significantly raised tariffs rates on China. We were concerned that the showdown between the two countries could be prolonged and painful, with only losers on both sides.
The following are changes we made to AlphaGlider strategies in mid-April and the logic behind them. We made these changes to reduce the downside risks from a possible return of high tariff rates at the end of Trump’s 90-day pause, or a multi-year period of global business uncertainty caused by Trump’s erratic and transactional negotiating style:
Lower US dollar exposure via lower US fixed income exposure and higher unhedged (i.e. local currency) international government bond exposure
- trimmed aggregate US bonds
- bought unhedged foreign government bonds
- slowing economic growth to force foreign central banks to cut rates, driving up foreign bond prices (US central bank may not be able to cut rates as aggressively as US tariffs are expected to raise inflation)
- unhedged to benefit from weakening US dollar
Higher commodity exposure
- bought a broad-based basket of commodities indexed to the Bloomberg All Commodity (~30% energy, 29% agriculture, 20% precious metals, 15% industrial metals, 5% livestock)
- real assets like commodities are a hedge against inflation
- real assets are a hedge against weakening USD
Lower exposure to China
- trimmed our current emerging markets fund which is ~33% China
- bought emerging markets equity fund that excludes China
went from 10-15% overweight China to 25-30% underweight
Lower US small cap equity exposure
- trimmed US small cap equity
- small caps generally have higher debt levels, thus higher interest rates are particularly painful
- small caps have less ability to lobby Trump administration for tariff breaks
- small caps have less flexibility and resources to adjust supply chains in reaction to tariffs
Along with these changes, we also performed some rebalancing and tax loss harvesting—basically, we bought what sold off hard in reaction to Trump’s "reciprocal" tariffs announcement, funded by selling foreign bonds that had held up well. This boosted our returns in the second quarter as there was a strong relief rally (the TACO trade) in those beaten down assets.
The OBBBA and You5
At 870 pages, you, and most likely your representatives in Washington, have not read the recently passed tax reconciliation bill. But no worries, here’s an abbreviated list of the more important changes in the bill that will affect at least some of my readers:
Permanent extension of the expiring tax cuts included in the 2017 Tax Cuts and Jobs Act (TCJA)—comprising $4.5 trillion in cost over 10 years. This includes the TCJA's tax brackets, increased standard deduction, Section 199A deduction for Qualified Business Income (QBI), and increased Child Tax Credit. An increased standard deduction threshold—there’s a $1,150 increase for individuals/$2,300 increase for those married filing jointly, to $15,750 and $31,500, respectively.
A temporary $6,000 senior deduction increase for those 65 and older, subject to a phase-out starting at $75,000 in income for single filers and $150,000 for those married filing jointly, and ending at $175,000 and $250,000, respectively. This bonus deduction expires in 2029 and applies whether you take the standard deduction or itemize deductions.
Individuals claiming the standard deduction will be able to deduct up to $1,000 in charitable donations, and up to $2,000 for married couples, starting next year. Previously, one could not deduct charitable donations if they claimed the standard deduction. With the substantial increase in the size of the standard deduction in the 2017 TCJA, around 90% of tax filers claim it instead of itemizing deductions.
Taxpayers who itemize deductions lost some ability to deduct charitable donations. Under the new law, taxpayers who itemize can only itemize charitable gifts that exceed 0.5% of their adjusted gross income. Previously the first dollar gifted was deductible for those that itemize.
An increased state and local tax (SALT) deduction for those who itemize—this deduction was raised from $10,000 to $40,000, with a 1% increase in the cap each year through 2029 before returning to the $10,000 limit for 2030. The deduction begins to phase out for households (regardless of being single or married) with more than $500,000 of income, and ending at $600,000 at which point the allowed deduction returns to $10,000. This could be beneficial if you live in a state with high state income and property taxes.
An increased estate tax exemption—this will increase from $13.99 million in 2025 to $15 million in 2026 for individuals and from $27.98 to $30 million for those married filing jointly. The 2017 TCJA had this tax exemption reverting to just over $7 million for individuals next year. This change is permanent, which means it will last until the next act of Congress.
You might lose the free coffee, snacks, and on-site lunches at your workplace. Starting in 2026, these expenses will no longer be considered deductible to companies.
Individuals participating in Medicare Part A who are still working and enrolled in a high-deductible healthcare plan (HDHP) will now be eligible to continue contributing to a health savings account (HSA).
If you were thinking of buying a new or used electric vehicle (EV), do so soon. The $7,500 federal EV tax credit for new EVs and $4,000 credit for used EVs was supposed to last through the end of 2032, but will now end on 30 September.
But if you have your eyes set on a vehicle assembled in the US and you like to finance your new vehicles, you are in luck. You will be able to deduct up to $10,000 per year in interest expenses on said vehicle from 2025 through 2028, even if you use the standard deduction. However, the deduction begins to phase out for individuals earning over $100,000 and couples earning over $200,000.
529 plan changes—the limit on K-12 expense rises from $10,000 to $20,000 in 2026, and the list of eligible expenses are expanded beyond its current restriction to tuition. 529 funds can now be used for expenses associated with acquiring and maintaining certain professional credentials.
As of 2027, any person or company will be able to donate up to $1,700 per year to a state-approved non-profit Scholarship Granting Organization (SGO) and receive a 100% federal income tax credit (credit, not a deduction), so long as they otherwise owe at least $1,700 in federal tax and their state has opted in to the scheme (many blue states are not expected to opt in to the scheme). The SGO then distributes funds to students to cover a wide range of expenses associated with attending a public, private, or religious K-12 school if their family makes less than three times the median income within their locality. This controversial scheme effectively funds private and religious K-12 schools with federal dollars. As an example, AlphaGlider, my wife, and I could each donate $1,700 ($5,100 total) to an SGO in our home state of Texas. The SGO in turns awards a $5,100 scholarship to a financially qualifying student attending a private school in Texas. When we file our taxes, we will owe $5,100 less in taxes to the IRS due to this donation. Thus there was no cost to us to make the federal government pay for $5,100 in private schooling this year. The rule is permanent and has no spending cap, making the cost of this provision difficult to predict. Congress’s Joint Committee on Taxation estimates the plan will initially cost $3 billion to $4 billion annually and go up over time.
There are obviously many more provisions in this massive bill that affect you, but I tried to name the most common and impactful ones that affect my readership base. Note than I nor AlphaGlider provide tax advice, so please consult with your tax advisor regarding your individual circumstance.

New Financial Planning Software
I am thrilled to announce a major upgrade to AlphaGlider’s financial planning software. We will now use software from RightCapital which we find to be more intuitive, interactive, and sophisticated than the software we had been using. Several AlphaGlider clients have already transitioned to it and have received new insights and actionable recommendations that should improve their long-term financial security. There will be some time commitment from both you and from me to populate your details into the software, but I highly recommend that you take advantage of this new financial planning capability on offer from AlphaGlider. If I have not yet invited you to set up your login credentials and begin inputting your information, expect me to do so over the coming weeks.

Going forward I will call this new financial planning software “AlphaGlider Planning,” or just “AG Planning” for short. After setting up your account, you will be able to access it at app.rightcapital.com/account/login or via its mobile app (iOS here, Android here).

We will still use your account on the old financial planning software (from Advizr) as it will continue to warehouse your quarterly statements from AlphaGlider, your tax forms and monthly statements from Schwab (in the “Document Vault” menu item on the left), as well as historical performance information on your AlphaGlider-managed investment accounts (in the “Personal Finances” menu item). Going forward I will call this website “AlphaGlider Vault,” or just “AG Vault” for short. You will continue to access your account on AG Vault at alphaglider.advizr.com or via the mobile app (iOS here, Android here).
NOTES & DISCLOSURES
1This material represents an assessment of the market and economic environment at a specific point in time and is not intended to be a forecast of future events, or a guarantee of future results. Forward-looking statements are subject to certain risks and uncertainties. Actual results, performance or achievements may differ materially from those expressed or implied. Information is based on data gathered from what we believe are reliable sources. It is not guaranteed as to accuracy, does not purport to be complete, and is not intended to be used as a primary basis for investment decisions. It should also not be construed as advice meeting the particular investment needs of any investor.
2Mutual funds, exchange-traded funds and exchange-traded notes are sold by prospectus. Please consider the investment objectives, risks, charges, and expenses carefully before investing. The prospectus, which contains this and other information about the investment company, can be obtained directly from the Fund Company or your financial professional. Be sure to read the prospectus carefully before deciding whether to invest.
3Alternative investments, including hedge funds, commodities and managed futures involve a high degree of risk, often engage in leveraging and other speculative investments practices that may increase risk of investment loss, can be highly illiquid, are not required to provide periodic pricing or valuation information to investors, may involve complex tax structures and delays in distributing important tax information, are subject to the same regulatory requirements as mutual funds, often charge higher fees which may offset any trading profits, and in many cases the underlying investments are not transparent and are known only to the investment manager. The performance of alternative investments including hedge funds and managed futures can be volatile. Often, hedge funds or managed futures account managers have total trading authority over their funds or accounts; the use of a single advisor applying generally similar trading programs could mean lack of diversification and, consequently, higher risk. There is often no secondary market for an investor’s interest in alternative investments, including hedge funds and managed futures and none is expected to develop. There may be restrictions on transferring interests in any alternative investment. Alternative investment products including hedge funds and managed futures often execute a substantial portion of their trades on non-US exchanges. Investing in foreign markets may entail risks that differ from those associated with investments in the US markets. Additionally, alternative investments including hedge funds and managed futures often entail commodity trading which can involve substantial risk of loss.
4Rebalancing can entail transaction costs and tax consequences that should be considered when determining a rebalancing strategy.
5AlphaGlider LLC does not offer legal or tax advice. Please consult the appropriate professional regarding your individual circumstance.
^Indices are unmanaged and investors cannot invest directly in an index. The performance of indices do not account for any fees, commissions or other expenses that would be incurred.
aThe Standard & Poor's 500 (S&P 500) Index is a free float-adjusted market capitalization weighted index that is designed to measure large cap US equities. The index includes 500 leading companies and captures approximately 80% coverage of available market capitalization in the US equity markets.
bMSCI Europe, Australasia and Far East (EAFE) Index is a free float-adjusted market capitalization weighted index that is designed to measure the investable universe of developed market equities outside of the US.
cMSCI Emerging Markets (EM) Index is a free float-adjusted market capitalization weighted index that is designed to measure large and mid-cap equity market performance in the global Emerging Markets.
dMSCI All-Country World (ACWI) Investable Market Index (IMI) is a free float-adjusted market capitalization weighted index that is designed to measure the investable universe of global equity markets.
eThe Bloomberg Barclays US Aggregate Bond Index is a market capitalization weighted index that is designed to track most investment grade bonds traded in the United States. The index includes Treasury securities, government agency bonds, mortgage-backed bonds, corporate bonds and a small amount of foreign bonds traded in the United States. Municipal bonds and Treasury Inflation-Protected Securities (TIPS) are excluded due to tax treatment issues.
Copyright © 2025 AlphaGlider LLC. All Rights Reserved.
No part of this report may be reproduced in any manner without the express written permission of AlphaGlider LLC.