
INVESTMENT ENVIRONMENT1
Source: Orion Advisor Services, AlphaGlider
Rising inflation and war in Europe triggered a sell-off in global fixed income and equity markets during the first quarter of 2022. Global equity markets were down 5.5% as measured by our equity benchmark, MSCI ACWI IMI,^d with the US market faring slightly better than those abroad. The US fixed income market, as measured by our fixed income benchmark Bloomberg US Aggregate,e declined 5.9%.
Over the last 12 months, global equity markets were up 6.3%, but there was a wide dispersion among the regions. The US market was up over 15% while emerging markets fell over 11%. The US fixed income market declined 4.2% over this period.
The most striking economic feature during the quarter was the continued rise in inflation. Prices in the US rose 8.5% year-over-year in March as tracked by the Consumer Price Index (CPI), a four decade high. Excluding volatile food and energy prices (i.e. core inflation), the increase was 6.5%. As the chart below shows, inflation is spiking in many countries, but still remains modest in China and Japan, major economies that are still adhering to strict Covid protocols.

Source: The New York Times
In response to inflation concerns, the Federal Reserve (Fed) raised its benchmark overnight rate by 25 basis points (0.25% points) to a range of 0.25% to 0.5%. This time last year, Fed board members hadn’t expected to begin increasing rates until 2024. The market is now pricing in the Fed rate to peak around 3.15% in mid-2023, including greater than 80% probabilities of 50 basis point increases this May and June. The Fed also signaled that it expects to begin to reduce its bloated $9 trillion balance sheet in May by not replacing approximately $60 billion in Treasuries and $35 billion in mortgage-backed securities monthly as they mature. At this rate of quantitative tightening, it will take just over four years to get the Fed’s balance sheet back to its $4.2 trillion pre-Covid level.
The Fed is attempting to thread the needle, trying to subdue inflation with rate increases and quantitative tightening without triggering a recession. The chart below shows how difficult it can be to contain inflation with rate increases without tipping the economy into a recession. The Fed has attempted this five times since the mid-1980s and four of those times the US economy fell into recession.

Source: Capital Group, AlphaGlider
The yield curve, as measured by the difference between the yields on the 10-year and 2-year Treasuries, briefly inverted during the quarter (i.e. the yield on the 10-year was less than the yield on the 2-year). Inverted yield curves are highly correlated with subsequent recessions — as is readily visible in the chart below of 10/2 yield curve inversions over the last 45 years. When the line goes below zero, gray times are not far behind (gray in the chart indicates periods in recession). The six recessions since 1977 shown on this chart were all preceded by 10/2 yield curve inversions, with an average of 19 months afterwards.

Source: St. Louis Fed, AlphaGlider
And just as important, there were no false signals to this indicator. To be clear, there’s no magical cause and effect here, but if the correlation holds up, the US is looking at a recession as soon as this fall or as late as early 2025.
There’s a lot that has been written on the economic effects of Russia’s callous and unjustified invasion of Ukraine, but I would like to focus my comments on the potential knock-on effects from prolonged commodity inflation caused by the war, particularly food and energy.
Ukraine and Russia are both vital exporters of grains and cooking oils, particularly to poorer nations. As we saw in the Arab Spring of 2011, food inflation and the economic pressure it exerts on populations can be important drivers of political instability. At the moment the greatest risks are in North Africa and the Middle East, but they could spread to more consequential developing economies in Latin America and Southeast Asia if the war in Ukraine persists.

As we are reminded each time we pass a gas station, the partial reduction of Russia’s oil and natural gas exports from sanctions has immediate inflationary impacts to all regions of the world. Since the invasion, the price for a barrel of oil has bounced between $95 and $125. Not only do we feel the hit when we fill up our tank, but it also plays an important part in the inflation of all physical goods due to their input and transportation costs. Like with inverted yield curves, there is a solid correlation between oil price shocks and recessions in the US (and probably even stronger correlations in other developed markets that don’t have substantial domestic oil supplies like the US) — as shown below.

Source: @MacrobondF, h/t The Daily Shot
So now I’ve shown three economic events (aggressive rate increases, oil price shocks, and inverted yield curves) that coincide with recessions, albeit with some lag. It’s unlikely that any one of the events is the driver of lower economic output and recession, but rather it is the interplay between them that pushes the economy into recession. For example, an oil price spike may lead to elevated inflation throughout the economy. In response, the Fed may raise rates to subdue that inflation. The Fed’s rate increases most directly increase the short end of the yield curve (after all, the Fed’s rate is of the overnight variety). Higher borrowing costs cause less short-term borrowing by businesses and in turn less investment in growth by these businesses, thereby weakening medium to longer term economic growth expectations. These lower growth expectations translate to lower medium to long term interest rates. With short-term rates increasing but longer term rates stalling or decreasing, the yield curve flattens, and then inverts. And then the recession follows, more times than not.
Fed Chairman Powell has stated his confidence that the Fed can thread the needle (defeat inflation without causing a recession), but the previous charts show just how hard a feat it will be. But these are unique times with events that we haven’t experienced in isolation, let alone simultaneously, in post WWII economic history. There are some reasons to be optimistic that Powell and the Fed can pull off a soft landing this time.
First, the primary driver of our current high inflation environment was the pandemic, and if it ends soon, so too could inflation. The pandemic created a spike in pent up demand while restraining supply as workers got sick or hunkered down to avoid getting sick. With demand up and supply down, prices naturally rose. In the developed world, highly effective vaccines are now widely available, pay is higher, and government support is being reduced — all actions that are encouraging workers to return to work. The situation is less optimistic in China, the world’s largest goods exporter where vaccination rates and effectiveness are low. The Chinese government has reapplied strict Covid lockdowns in several cities and regions important to their exports. But perhaps we will see China lift the lockdowns over the near term, either because the Omicron wave subsides, or economic and social pressures force the government to do so.
Second, we could see oil and gas supplies rebound over the coming year. Higher prices are incentivizing more drilling. Nuclear talks with Iran appear to be progressing and could result in a lifting of the embargo on Iran’s oil exports. OPEC could bow to Western pressure to pump more. And with the Russia invasion in Ukraine stalled, perhaps we’ll see Russia pull back in exchange for reinstatement of some of its energy exports to Western Europe.
Lastly, the US economy is strong and may prove to be resilient to rising rates. The all important US consumer is healthy, with March unemployment at only 3.6% and household debt low. Likewise, US companies are doing well also, running with high operating margins and relatively low debt.
PERFORMANCE DISCUSSION
In a quarter where both global stocks and bonds fell, AlphaGlider strategies beat their respective benchmarks. This was particularly the case for our strategies at the more conservative end of the risk spectrum. Our attempts to protect our strategies against rising inflation with Treasury Inflation-Protected Treasuries (TIPS), shorter duration bonds, and physical gold paid off again this quarter — most of our fixed income holdings outperformed the -5.9% showing of our fixed income benchmark, the Bloomberg US Aggregate Bond Index. Our international-heavy equity holdings had been performing well during the quarter against our equity benchmark, the MSCI ACWI IMI — that was until Russia invaded Ukraine in late February. To no surprise, emerging markets and European equities took a big hit from the invasion. Our ESG strategies lagged their corresponding Core strategies due to their significantly lower exposure to well performing fossil fuel companies.
The following are individual funds that particularly helped, and hurt, our strategies’ relative performance during the quarter:
1Q22 benefactors to relative performance:
+5.8% SPDR Gold MiniShares, GLDM
-0.1% Vanguard ST Inflation-Protected Securities, VTIP
-3.1% Schwab US TIPS, SCHP
-2.5% Vanguard Short-Term Treasury, VGSH
-3.7% Vanguard Short-Term Corporate Bond, VCSH
-3.8% iShares ESG 1-5 Yr Corporate Bond, SUSB
+1.0% Vanguard Value, VTV
-2.2% Nuveen ESG Large-Cap Value, NULV
-1.1% Fidelity MSCI Consumer Staples, FSTA
-2.6% iShares MSCI Singapore Capped, EWS
-3.5% Vanguard Global Ex-US Real Estate, VNQI
1Q22 detractors to relative performance:
-8.7% Vanguard Europe, VGK
-7.5% Vanguard ESG International, VSGX
-6.2% Vanguard FTSE Emerging Markets, VWO
-7.6% iShares ESG Aware MSCI EM, ESGE
-6.0% SPDR Portfolio Developed World ex-US, SPDW
-8.9% Fidelity MSCI Information Technology, FTEC
Over the last 12 months, AlphaGlider’s more conservative strategies slightly outperformed their benchmarks, but AlphaGlider’s more aggressive strategies underperformed theirs. As in the past quarter, the spike in inflation helped the relative performance of AlphaGlider strategies. Likewise, overweighting of international equities and underweighting of domestic equities hurt our strategies’ relative performance over the last year.
The following are individual funds that particularly helped, and hurt, our strategies’ performance during the last 12 months:
LTM month benefactors to relative performance:
+13.2% SPDR Gold MiniShares, GLDM
+13.0% Vanguard Value, VTV
+16.5% Fidelity MSCI Information Technology, FTEC
+3.9% Vanguard ST Inflation-Protected Securities, VTIP
-0.4% Schwab US TIPS, SCHP
LTM detractors to relative performance:
-10.4% Vanguard FTSE Emerging Markets, VWO
-13.0% iShares ESG Aware MSCI EM, ESGE
-5.7% iShares MSCI Singapore Capped, EWS
-2.9% SPDR Portfolio Developed World ex-US, SPDW
-0.8% Vanguard Europe, VGK
-0.4% Vanguard Global Ex-US Real Estate, VNQI
OUTLOOK & STRATEGY POSITIONING
Back in my 2Q20 CIO Commentary I dedicated this section to the reasons why the market may have been “underestimating the probability and/or magnitude of higher inflation in the US in the years to come.” This was because of the surge in the M2 money supply from the US government’s monetary and fiscal stimulus programs, as well as the breakdown of international supply chains caused by the pandemic. Back then the market was betting on only 1.25% inflation, on average, over the next five years (see chart below). So we loaded up on Treasury Inflation-Protected Securities (TIPS), cut our fixed income portfolios’ durations (shorter duration is less sensitive to rate increases), and soon added physical gold to our strategies.
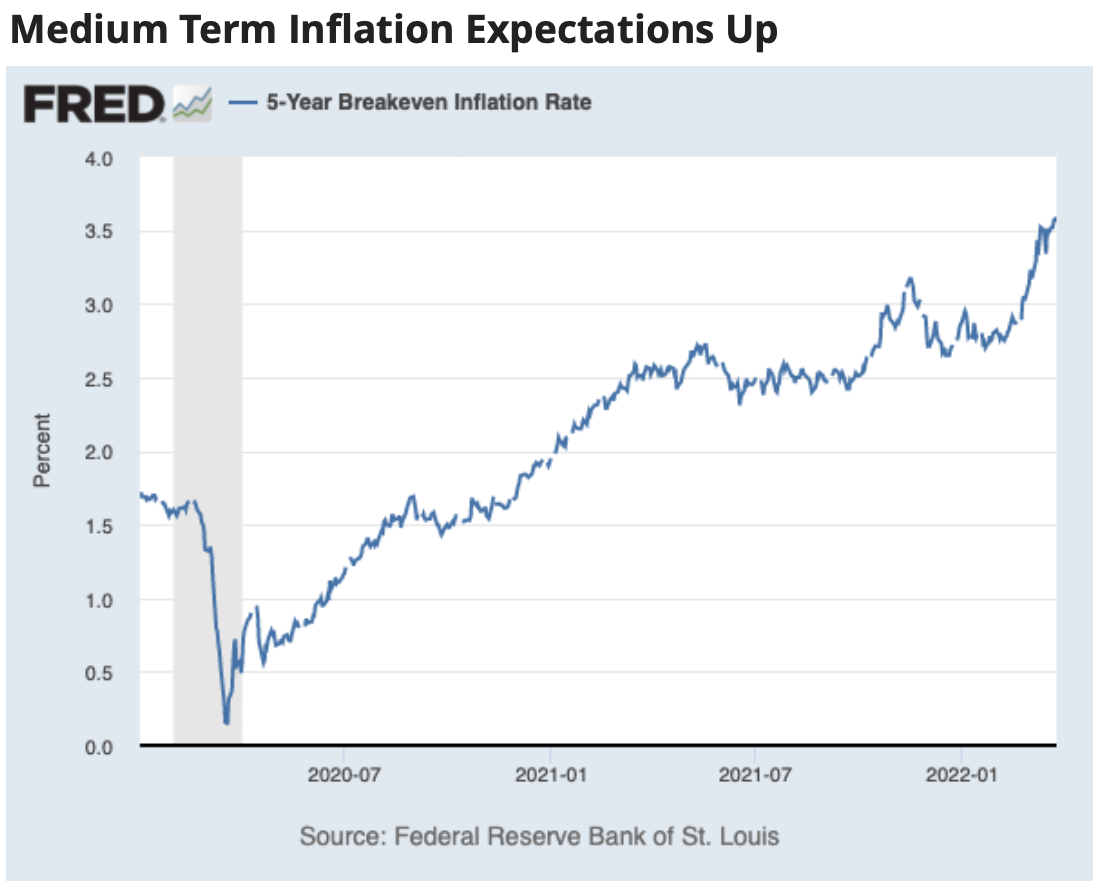
Fast forward to the present — we now have 8.5% inflation and a near tripling in expected 5-yr average annual inflation to around 3.5% (also on the previous chart). With significantly higher longer-term interest rates and inflation expectations, we think it’s time to rein back some of our positioning against their continued increases.
Although it feels like inflation will only get worse with no end in sight in the Ukraine war, and with China undergoing Covid lockdowns again, there are many forces that may very well temper inflation over the coming years. After all, the Fed finally seems be taking inflation seriously with its guidance on future rate hikes and reductions in its balance sheet. And the invisible hand of capitalism is also hard at work, with higher prices reducing demand while incentivizing more supply to come to market.
We sold down about one-half of our position in short-term TIPS across all AlphaGlider strategies, thereby increasing the average duration of our fixed income portfolios and lowering their TIPS exposure. Our strategies are still well protected, at least on a relative basis, against further increases in interest rates and inflation expectations, but a little less so after these trades.
We reinvested the proceeds of our short-term TIPS sale into the Vanguard Market Neutral (VMNFX) mutual fund. VMNFX takes equal amounts of long and short positions in every industrial sector of the US economy, remaining neutral in each of these sectors. We've invested in VMNFX in the past, but without much success. However, that was during a time of low and/or falling rates which benefited growth stocks over value stocks. I believe that time is over, at least over the short to medium term, which should help VMNFX.
In the more aggressive versions of our ESG strategies (AG-MA/esg & AG-A/esg), we swapped out their direct US tech exposure with the iShares Global Clean Energy (ICLN) ETF. ICLN has emerged as one of the more liquid and low cost funds investing in companies that are active in the clean energy space — mostly utilities, technology, and industrial companies from around the world. Although these companies are not cheap, their prospects have improved with the dramatic rise in fossil fuel prices (ie the alternatives) — a result of strong demand and weak supply coming out of the pandemic, and the recent direct and indirect sanctions against Russian oil and gas.
We also conducted some tax loss harvesting in taxable accounts where losses existed — mostly fixed income and international equity funds which suffered recently. We also conducted rebalancing in all of our clients’ portfolios to get them back to their respective strategy allocations after the big relative moves between equities and fixed income, and between US and international equities.
Finally, for those of my clients taking advantage of the financial modeling features of AlphaGlider Planning, we increased the long-term inflation assumption from 2% to 3%, the growth in social security growth from 2% to 3%, and long-term tuition inflation from 4% to 5%. We have also switch to JP Morgan’s 2022 capital market assumptions which have increased expected returns for many fixed income asset classes while reducing them for many equity asset classes. Net-net, I expect projected net income estimates to fall somewhat as a result of these assumption changes.
1% FOR THE PLANET


With 2021 in the books, AlphaGlider is pleased to announce that it made its 2021 1% for the Planet donation to BikeTexas. This Austin-based non-profit works to advance bicycle access, safety, and education by encouraging and promoting bicycling, increased safety, and improved conditions throughout the Lone Star State. For four years now, AlphaGlider has supported organizations which contribute to addressing the challenge of climate change — BikeTexas by working to make it easier for more people to get out of their car and onto a bike.
And on the topic of climate change, every six to seven years the Intergovernmental Panel on Climate Change (IPCC), an International consortium of scientists convened by the United Nations, publishes an extensive three-part report that summarizes the current advances in scientific understanding on climate change and its impacts. The last part of this report came out earlier this month and it makes for some depressing reading. That said, there is some impressive progress being made on the affordability of renewable energy and storage systems that I think is worth highlighting.
The following chart from the report shows that photovoltaics (PV, aka solar panels) and onshore wind turbine installations are now cheaper than the cheapest fossil fuel alternatives. I can vouch for this as the return on investment on a PV and battery system is attractive on the new home that my wife and I are building in New Zealand, despite not having government tax breaks as is the case in the United States.

The chart shows the dramatic drop in the cost for electric vehicle batteries, so much so that the total lifecycle cost of most electric vehicles is now cheaper than that of similar gasoline-powered cars. We are in the hockey stick phase of adoption of these technologies. If you haven’t already, I encourage you to run the numbers for your house and transportation needs to see if the move to more climate-friendly solutions makes economic sense for your situation.