
Photo by Chris Yarzab
INVESTMENT ENVIRONMENT1
Source: Orion Advisor Services, AlphaGlider
After a brief pause in the third quarter, the US equity market resumed its march upwards during the last quarter of 2021. The S&P 500,^a the index of the 500 largest US companies, increased 10.9% during the quarter and 28.2% for calendar 2021. That performance significantly outpaced our global equity index, MSCI ACWI IMI,d which was up 6.1% in Q4 and 18.2% for 2021. Equities in emerging markets missed out in the party, with the MSCI Emerging Marketsc index down -1.3% in Q4 and -2.5% for the year. Foreign developed markets had a solid quarter and year, with the MSCI EAFEb index up 2.7% and 11.3%, respectively.
Moves in the bond market were much more subdued than experienced by the equities markets. The Bloomberg US Aggregate Bonde index broke even during the fourth quarter and was down 1.5% for the entirety of 2021.
The S&P 500’s spectacular 51% run over the last two years was disproportionately driven by a handful of large cap technology stocks, such as Alphabet (Google), Amazon, Apple, Meta (Facebook), Microsoft, Netflix, Nvidia, and Tesla (see chart below). The remainder of the US market saw returns more inline with equity markets overseas.
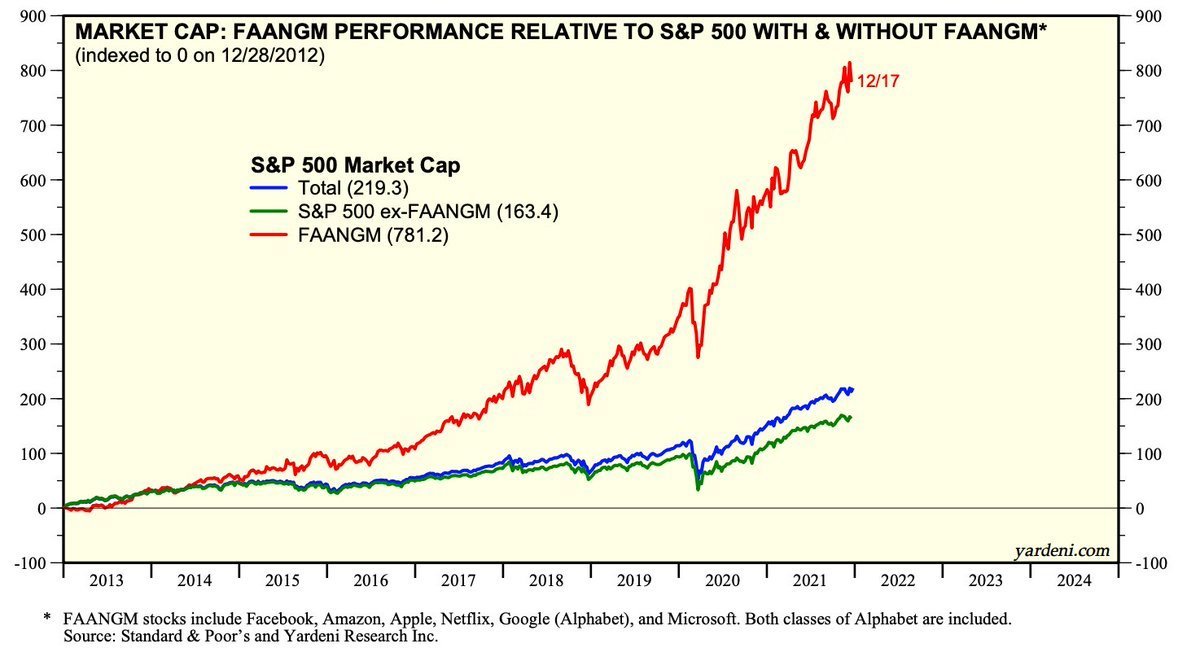
Source: yardeni.com
Much of the poor 2021 performance by emerging markets equities was due to its largest country component — China. The MSCI Chinaf index was down -21.7% during 2021. Investors soured on Chinese stocks after the government went after several industry sectors, including technology, education, and finance, and held onto its Covid-zero strategy which required frequent and lengthy lockdowns that shut down factories and ports. The forward price-to-earnings ratio for the MSCI China index fell by 25%, from 16x to 12x, over the course of the year. For some perspective, the US market trades at 21.8x forward earnings.
Two years after it was first discovered, the SARS-2-CoV coronavirus continues to thrive through its power to mutate. In November a new variant called omicron was first identified in southern Africa, and by the end of the year it became the dominant strain throughout the world. Although much more contagious than the delta variant, which had been the previously predominant strain, omicron appears to be less lethal. As shown in the series of charts below, the current number of Covid infections in the US has already far exceeded the peaks of previous waves, yet the number of hospitalizations and deaths is still somewhat lower. Although the Covid vaccines have been highly effective at preventing serious disease and death, one-third of eligible Americans remain unvaccinated.

Source: The New York Times
From an economic standpoint, this omicron wave of cases and hospitalizations is creating further havoc. Infections and the fear of infection have caused workers to delay their return to the office, schools to go back online, factories to close or cut back production, airlines to cancel tens of thousands of flights, ports and transport operations to reduce throughput, and service providers to cut hours, both in the US and abroad. As a result, we are likely to see reductions in Q1 GDP estimates, and upgrades to near term inflation caused by more supply chain bottlenecks.
Speaking of inflation, the year-on-year increase in the consumer price index (CPI) hit 6.8% in November and 7.0% in December — the highest experienced in 39 years. The Fed acknowledged that inflation was not as transient as they once believed, and that its persistence would likely require a quicker taper of their quantitative easing program (the purchase of Treasuries and mortgage-backed securities) and more aggressive increases in its federal funds rate. At its mid-December meeting, two-thirds of the 18 Federal Open Market Committee (FOMC) members were guiding to three 25 basis point rate increases in 2022, up from one-half of the members guiding to one rate increase at its September meeting (with the other half not expecting any increases). And on the topic of the Federal Reserve (Fed), President Biden reappointed Jerome Powell as Chair for a second term in November — cheering investors who are generally fans of stability and predictability.
The US Congress passed a bipartisan infrastructure plan during the fourth quarter. Originally pitched by the Democrats to include $2.3 trillion in spending over the next 10 years, the negotiating process reduced its final size to $1 trillion — of which only $550 billion is new spending. Some of the cuts from the Democrats’ initial infrastructure plan were shifted over to their education, welfare reform, and climate bill — Build Back Better (BBB). Although its size has been reduced from an original $3.5 trillion over 10 years to $1.75 trillion, the BBB bill appears to be in trouble because Joe Manchin, the Democratic senator from West Virginia, opposes it.
PERFORMANCE DISCUSSION
AlphaGlider strategies lagged their respective benchmarks during the fourth quarter, mainly due to their overweight positions in international equities and underweight positions in US equities. As in the third quarter, our emerging market equities were our worst performers (Vanguard FTSE Emerging Markets, VWO, -0.1%; iShares ESG Aware MSCI EM, ESGE, -2.1%), along with our Singaporean equities (iShares MSCI Singapore Capped, EWS, -1.6%). The bulk of our developed market equity investments finished in positive territory, but nowhere near the levels achieved by US equities (SPDR Portfolio Developed World ex-US, SPDW, +2.1%; iShares ESG Aware MSCI EAFE, ESGD, +2.8%). And although US real estate had a fantastic quarter (Vanguard’s US REIT ETF, VNQ, was up +15.0%), our strategies’ real estate exposure was concentrated overseas where returns were more modest (Vanguard Global Ex-US Real Estate, VNQI, +1.1%). The short duration of our fixed income holdings also detracted from performance as we saw short-term rates increase while longer-term rates held steady (Vanguard Short-Term Treasury, VGSH, -0.5%; Vanguard Short-Term Corporate Bond, VCSH, -0.7%; iShares ESG 1-5 Yr Corporate Bond, SUSB, -0.8%).
Positive contributors to AlphaGlider strategies during the fourth quarter once again included our large positions in inflation-protected Treasuries which handily outpaced the flat performance from our fixed income benchmark, the Bloomberg US Aggregate Bond Index (Schwab US TIPS, SCHP, +2.3%; Vanguard ST Inflation-Protected Securities, VTIP, +1.8%). Our gold ETF rebounded nicely in the quarter, after experiencing a rough patch earlier in the year (SPDR Gold MiniShares, GLDM, +4.1%). We also owned three US equity funds that outperformed the S&P 500’s 10.9% quarterly performance: Fidelity MSCI Information Technology, FTEC, +14.4%; Vanguard Dividend Appreciation, VIG, +12.3%; Fidelity MSCI Consumer Staples, FSTA, +12.2%.
For the 2021 calendar year the story was similar — AlphaGlider strategies’ lagged their benchmarks, primarily due to their overweight positions in international equities and underweight positions in US equities. Our emerging market equities were among our most disappointing investments (VWO +1.3%; ESGE -2.8%). Our developed market equities generated returns that would generally be considered excellent in a typical year, but 2021 was anything but typical: SPDW +11.4%; ESGD +11.8%; EWS +5.6%; VNQI +5.9%; Vanguard Europe, VGK, +16.9% vs the S&P 500’s 28.2%. Our gold holdings also disappointed, this despite greater than expected inflation during the year (GLDM -4.0%).
Our biggest successes in 2021 came from our fixed income holdings. With inflation on the rise, our inflation-protected Treasuries were strong relative performers (SCHP +5.9%; VTIP +5.4%). Within our underweight US equity position, our more aggressive strategies benefited from our tech sector ETF (FTEC +30.5%).
OUTLOOK & STRATEGY POSITIONING
The spike in consumer prices has been extraordinary since the onset of Covid, but it is not even close to the rise in asset prices. Homes are now less affordable for the median American family than they were back in 2006, the peak of the housing bubble. The real return (i.e. return after inflation) offered by US Treasuries is at all-time lows — or said another way, they have never been more expensive, (see chart below). Commodity prices are running hot, at least the ones that aren’t shiny yellow metal.
Buyers of a 10-Year Treasury expect 1% annualized destruction in their purchasing power for the next 10 years
Source: St. Louis Fed, AlphaGlider
Seems that everything but gold is bubbling at the moment, but perhaps none more than US equities. The proxy for the overall US stock market, the Wilshire 5000,g entered 2022 with a value greater than double the US gross national product (see chart below). This relative valuation, commonly referred to as the Buffett Indicator, is the highest in history and approximately triple its average over the last 30 years. It is approximately 50% higher than the peak reached during the dot-com bubble.
Source: Longtermtrends
The S&P 500’s cyclically adjusted price-to-earnings ratio (CAPE; aka Shiller PE) hit 40x exiting 2021 — not yet at the dot-com bubble peak, but not that far off. And the S&P 500’s price-to-sales ratio is at an all-time high entering 2022: 3.2x, nearly 90% higher than its average over the last 20 years (see two charts below).
Source: Longtermtrends

Source: multpl.com
We believe that much of the inflation we’ve seen in US equities over the past dozen years, and in global asset prices more generally, has been caused by massive money supply growth (i.e. quantitative easing) and ultra-low interest rates provided by the Fed other major central banks. They aggressively pursued these actions in reaction to the global financial crisis. When the Covid pandemic hit, these central banks doubled down on them at the same time that governments, led by the US, rolled out massive fiscal programs.
The strategy succeeded, especially in the US, in stimulating economic growth and buoying stock prices. But now the strategy, along with supply chain constraints triggered by the pandemic, have caused consumer product prices to spike to levels not seen in 39 years (see chart below). Back in mid-2021, the Fed held to their strategy on the belief that consumer price inflation was mainly caused by supply chain constraints and thus was “transitory.” But recently they began to worry that this inflation could run hotter for longer if they don’t apply the brakes sooner and harder.
Source: St. Louis Fed, AlphaGlider
The gap between inflation (blue line on the above chart) and the Fed funds rate (red line) is currently at an all-time high, creating concerns that the Fed waited too long contain inflation. The Fed finds itself in a tight spot, needing to reign in inflation by tapering its balance sheet and moving rates out of the basement, but not doing so too quickly or aggressively such that they trigger a recession and/or a sell-off in equity and other asset prices. One only needs to look at this chart to see that most of the recessions over the last half century (see shaded areas in the chart) have been preceded first by stints of rapidly rising inflation, and then by the Fed scrambling to catch up with numerous increases in its federal funds rate.
And speaking of tight spots, that’s where we find ourselves as investors in this risky, highly priced market. But, as with many things in life, we shouldn’t worry or stress over things that are not in our control. We should focus our time and energy addressing the issues over which we do have influence — building resilient, risk-appropriate investment portfolios that minimize costs and taxes,5 and prioritize long-term risk-adjusted returns. Below are three examples of how AlphaGlider has done this over the past quarter:
1) Tax loss harvesting (TLH)
Taxes are inevitable, but with careful planning we can delay and lower them, enhancing our clients’ after-tax returns. One of the ways we do this is with TLH — the practice of realizing taxable losses of an invest during the early periods of ownership. TLH can be challenging to perform after a period of strong investment performance, but we were still able to find a few TLH opportunities for some of our clients as the year ended.
Below is an example of the after-tax gain enhancements that can be made with TLH. It assumes the investor, with a 30% marginal income tax rate and a 20% long-term capital gains tax rate, makes a $30,000 investment that declines 10% within its first year, but then goes on to double from its low. Without TLH, the client would have had an 80% pre-tax return and a 64% after-tax return. With TLH, the client would have increased their after-tax return to 67.3% — providing them an additional $1,020 in after-tax proceeds. If this example had taken place over five years, the annualized return difference between using TLH, and not, would have been 45 basis points (0.45%). I’ll walk you though the mathematics of this TLH example:
Source: Vanguard
- Investor makes a $30,000 investment.
- Within the first year, the investment declines 10%, at which time the investor sells, realizing a $3,000 short-term capital loss; this generates a $900 tax credit/reduction for the investor (30% marginal income tax rate * $3,000 loss).
- Soon after the sale, the investor invests the $27,000 proceeds from the sale and the $900 tax benefit into a similar, but not identical (so as to avoid a wash sale), investment that is expected to perform similarly to their original investment.
- Investor sells this new investment after it doubles, generating a $27,900 long-term capital gain which is taxed at 20% — leaving the investor with $50,200 in after-tax proceeds. This is $1,020 more than the after-tax return had the investor not used TLH, a product of paying a lower tax rate on $3,000 of the gain [(30%-20% tax delta) * $3,000 gain = $300], and generating returns on the $900 tax benefit ($900 gain less 20% tax =$720).
The benefits of TLH will vary from client to client, but they obviously can only be generated for AlphaGlider clients with at least one taxable investment account under management. Generally speaking, TLH gains will be greater as initial losses are larger and more frequent, as subsequent gains are larger and quicker, and for clients with a higher spread between their marginal income and long-term capital gains tax rates.
2) Lower investment costs
We’re always on the lookout for ways to lower the cost of our investment strategies, and that’s why we rely so heavily upon Vanguard’s line-up of exchange-traded funds (ETFs). As you may know, Vanguard is not a for-profit company. Instead, it is owned by its funds, which in turn are owned by its shareholders (i.e. us). The company aims to run without turning a profit or loss by setting its fund fees accordingly. As most of its competitors set their fund fees to turn a profit, it’s no coincidence that Vanguard’s funds are usually the lowest in their respective categories. Lower fees attract more assets, which in turn generate more revenue and lower average service costs. In order to keep from turning a profit with this increased scale, Vanguard has to continually lower the fees for the funds that grow in assets. Low costs attract fund flows, which lowers costs, which attracts funds flows, etc. — a virtuous circle.
This past quarter Vanguard lowered fees on a slew of short-term bond funds that we owned, taking the fund management fees on our Core strategies down by nearly 4% for our most conservative strategy (which is heaviest on bond funds), to 0.3% for our most aggressive strategy (and lightest on bond funds).
Source: AlphaGlider
Our ESG strategies also benefitted from these Vanguard bond fund fee reductions, but it was hefty fee reductions in two separate Vanguard ESG equity funds that significantlylowered their fund management fees. Our most aggressive ESG strategy (which is heaviest on equity funds) had its fund management fee reduced by over 22%, while our least aggressive ESG strategy had its fees reduced by nearly 8%. On a $1 million ESG portfolio, that equates to annual savings of between $82 and $396.
3) Be scrappy
Sometimes the best investment option isn’t available from your favorite investment advisor. That was the case exiting 2021, as well entering 2022 — at least for the most conservative portion of one’s portfolio. Right now you can earn an annualized 7.12% rate for the next six month on risk-free, state tax-free Series I Savings Bonds from the US Treasury. The main catches are that you are capped at investing only $10,000 per calendar year and the bonds have a minimum holding period of one year. Check out
my blogpost on I Bonds
for more details.
While we may not like the investment environment we’re in at the moment, we are focusing on the issues that we can control. The three examples of actions we made in the fourth quarter may be small in isolation, but they, and others like them, can add up to a big deal to your after-tax returns, especially when compounded over years and decades. We are working hard to keep costs down, delay and reduce taxes, stay diversified, underweight areas of the market that we find to be overvalued areas and overweight the areas we find fair to attractively valued. All in all, we strive to deliver an investment portfolio to you that is efficient, resilient, and risk appropriate, especially over the longer-term.