
Photo credit: Katherine Frey/The Washington Post
Source: Orion Advisor Services, AlphaGlider
INVESTMENT ENVIRONMENT1
Most global investment assets were off to the races during the second quarter of 2020. Global equity markets (MSCI ACWI^d) increased by nearly 20%, led by the US (S&P 500a +20.4%) and emerging markets (MSCI EMc +19.8%). The broad index of US fixed income assets (Bloomberg Barclays US Aggregate Bonde) increased by nearly 3%, paced by corporate issuers. Interest rates were relatively stable during the quarter.
Despite strong Q2 performance, global equity markets were still down for the first half of the year, -7.1%. Led by strong performance in its technology stocks (NASDAQ 100f +14.5%), the US market was the relative outperformer during this period, down 3.4%. Emerging market equities were down nearly 10% while developed market equities were down over 11%. The large drop in interest rates across all durations aided the broad index of US fixed income to an increase of over 6% during H1.
COVID-19 was spreading rapidly around the world at the beginning of COVID-19 was spreading rapidly around the world at the beginning of Q2, but aggressive (and economically damaging) stay-at-home orders, expansion of testing and contact tracing capacity, and physical distancing and face coverings mandates helped turn the tide in many countries during the quarter. Countries that willfully deviated from taking these actions, most notably Brazil, Sweden, and the US (highlighted in red in the following two charts), are losing the battle to contain the coronavirus within their populations.
Source: OurWorldInData.org, AlphaGlider
A positive development in nearly all countries, regardless of their success or failure in controlling new cases, is the reduction in the death rate of individuals infected by COVID-19. Epidemiologists attribute the lower rate to the declining average age in those being infected and improved post-infection treatment regimes (e.g. remdesivir and dexamethasone). The “flattening of the curve” of new infections also helped prevent the over-utilization of scarce hospital resources. Yet by the end of Q2, COVID-19 had claimed the lives of over 500,000 people around the world, of which over 130,000 (25% of the total) were in the US.

Source: OurWorldInData.org, AlphaGlider
Although the US’s federal and state responses have been weak, uncoordinated, and generally ineffective at containing COVID-19 relative to most other developed nations, its central bank response has been unquestionably more beneficial — the Federal Reserve’s (Fed’s) monetary stimulus is more than double other banks’ stimulus, as a percent of gross domestic product (see dark blue columns in chart below). The Fed brought its bazooka to the fight, pledging to do whatever it takes to avoid a full blown financial meltdown. It lowered overnight rates by 150 basis points to 0-0.25%, resumed quantitative easing (purchasing government and corporate bonds), and initiated many other actions to ensure liquidity throughout the US and international banking systems. Since the beginning of the pandemic, total assets held by the three major central banks (Fed, European Central Bank, Bank of Japan) soared $5.6 trillion to a record $20.1 trillion (Fed’s portion is over $7 trillion).

The previous chart also shows the significant fiscal response to the pandemic from most of the world’s major economies (e.g. spending, benefits, and tax cuts; see maroon columns). Despite the massive spike in unemployment caused by the stay-at-home orders, Americans’ aggregate income actually increased by approximately $1.5 trillion annualized (see chart below) due to state unemployment insurance and new federal programs such as the Pandemic Emergency Unemployment Compensation (adds 13 weeks of unemployment insurance benefits to states’ benefits), the Paycheck Protection Program (to help pay small business employees), Pandemic Unemployment Assistance ($600 weekly enhanced unemployment benefits), and IRS Economic Impact Payments ($1,200 stimulus checks). Nearly 30% of all Americans’ income is coming from the government now, as shown below.

The US economy began to recover in May as the stay-at-home orders began to be lifted. June's US unemployment rate stood at 11.1% in June (measured mid-month) after peaking in April at 14.7%. This strong economic rebound was also confirmed by both the manufacturing and service sectors (see chart below, PMI readings above 50 indicated expansion versus the previous month).

Optimism about a v-shaped US economic recovery, however, may be misplaced. New COVID-19 cases in the US nearly doubled over the second half of June, causing many of the most affected states (e.g. Florida, Texas, Arizona, California) to begin to reimpose restrictions that will negatively impact economic activity going forward. Also dampening the US economic outlook is the expiration of some of the fiscal stimulus that helped during the stay-at-home orders, as well as cooler temperatures which will add flu patients to the country’s hospitals and perhaps increase COVID-19 transmission rates.
Sell-side analysts are forecasting S&P 500 earnings per share (EPS) to fall 43.5% in Q2 (FactSet), and by nearly a quarter for the entire 2020 calendar year (I/B/E/S). For 2021, they expect earnings to bounce back to 2019 levels. Below is a chart by economist Dr. Ed Yardeni which shows historic S&P 500 EPS and the declines in sell-side forecasts of 2020-2022 EPS, in addition to his own, more bearish, forecasts. Needless to say, uncertainty over future corporate earnings outcomes is higher than usual due to a pandemic that may still be in its earlier stages.
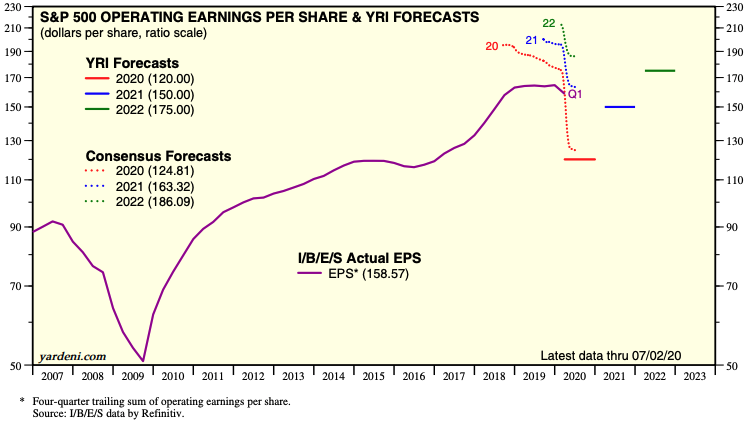
Source: Yardeni Research
Another source of considerable volatility for the US investment markets is the upcoming presidential election. Having survived his January impeachment trial and riding the tailwinds of a strong economy and low unemployment rates, Donald Trump was the odds-on favorite against a crowded and fragmented field of Democratic candidates. But the tide began to turn in March as the moderate wing of the Democratic Party coalesced behind Joe Biden, and as domestic COVID-19 cases quickly ramped. Trump's politicized and anti-scientific response to the pandemic appears to have turned off some voters who straddle the middle.

Source: ElectionBettingOdds.com, AlphaGlider
However it was in late May that the polls started to show a rapid shift to Biden. This coincided with the release of a video in which a white Minneapolis police officer choked, and eventually killed, an unarmed black man, George Floyd. June was filled with large and mostly peaceful racial injustice protests around the US, as well in the other countries. Trump responded to these protests with a partisan, “law and order” message that played well to his base, but less so to more independent voters Trump needs in November, particularly women. Exiting June, the betting markets were giving Biden a nearly 60% chance of winning. Bettors are waging that Arizona, Wisconsin, Michigan, Pennsylvania, North Carolina, and Florida will turn blue after having gone for Trump in 2016.

Source: PredictIt
Betting markets are putting on an even higher probability on Democrats flipping the Senate. Much can happen between now and November, but investors are increasingly mulling over the implications of Democratic control of the Senate, House, and presidency. Although there may be individual companies and sectors that benefit (e.g. companies that buy, sell, and/or otherwise impacted by Trump’s tariffs and trade wars) or lose (e.g. energy, healthcare, defense), all would be negatively impacted by a rollback of Trump’s corporate tax cuts should the Democrats prevail. Goldman Sachs estimates that Biden’s proposed tax plan would reduce S&P 500 EPS by about 12%, all else held constant.
The COVID-19 pandemic was also the main story outside of the US during Q2, but I will mention a series of international stories that also caught our attention. Tensions between China and the rest of the world took a step up, much of it initiated by China. Chinese and Indian soldiers clashed on their disputed border in the Himalayas, leaving at least 20 Indians and an undisclosed number of Chinese dead. China imposed a harsh security law in Hong Kong that effectively ended the “One country, two systems” principle to which China agreed when it took control from the British in 1997. China stepped up its fighter jet encroachments into Taiwanese airspace, raising fears that Taiwan could be the next Chinese target after Hong Kong. China appears to be on the verge of signing a sweeping trade and military partnership with Iran, in defiance of American sanctions. And China is reneging on the phase one trade deal that it signed with the US in January.
For its part, the US recently announced that it would revoke Hong Kong’s special trade status (tariffs and high tech restrictions that are applied to China will now be applied to Hong Kong), conducted joint exercises in the South China Sea with two of its carrier groups, approved the sale of advanced torpedoes to Taiwan, and applied sanctions against Chinese officials responsible for the “eroding Hong Kong’s autonomy” and human rights violations against Muslim minorities in Xinjiang. Regardless of who wins the presidency in November, future relations between the world’s two largest economies look to be fraught with conflict.
PERFORMANCE DISCUSSION
What worked well over the recent decade-plus equity bull market worked especially well during Q2 and H1. Simply put, domestic outperformed international, large capitalization (cap) outperformed small cap, expensive outperformed cheap, growth outperformed value, and tech crushed everything. Draw your Venn diagrams around these outperformers and you get the biggest US tech stocks — Microsoft, Apple, Amazon, Alphabet (e.g. Google), Facebook, and Netflix.

Source: DoubleLine
The above chart was from the middle of Q2, but the trends only accelerated into the end of the quarter. These six companies generated nearly all of the global equity market growth over the last five and a half years. The remainder of the US equity market as well as all foreign equity markets went sideways, in aggregate.
The chart below shows year-to-date performance through July 3 of the market cap segments of the S&P 500 companies. The larger the companies, the better the performance. The more expensive the companies, the better the performance.

Source: Ben Carlson/@wealthofcs
P/E: price to earnings ratio; P/S: sales; P/FCF: free cash flow; P/B: book
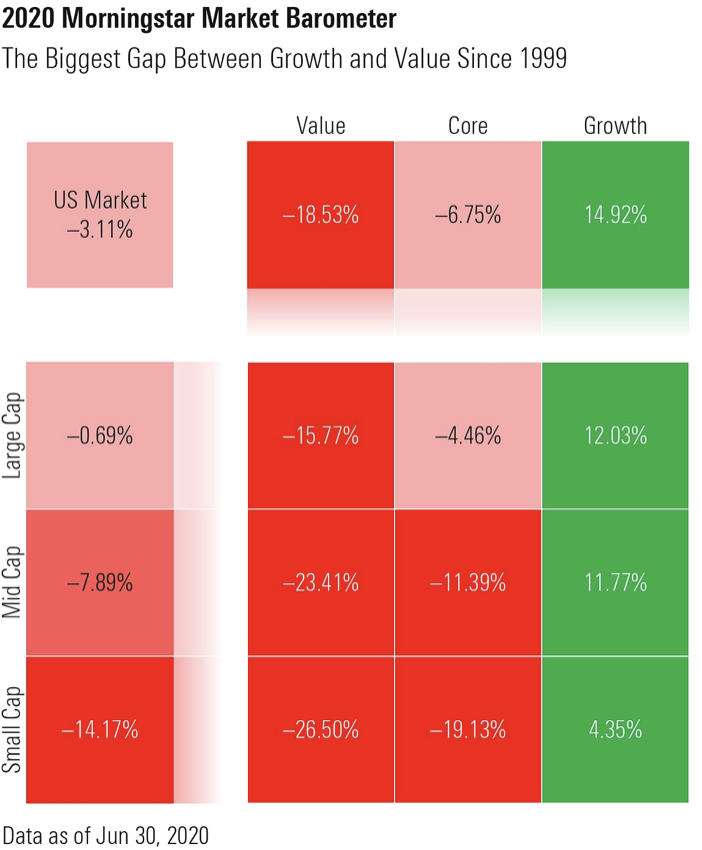
Source: Morningstar
To the right is a graphic from Morningstar that the slices up the US equity market’s H1 performance by market cap and investment style (value/core/growth). Although the US equity market was down a little over 3% during this period, large cap growth investors did especially well (+12.0%, not bad for in a half year with a pandemic and global economic recession), while small cap value investors got crushed (-26.5%).
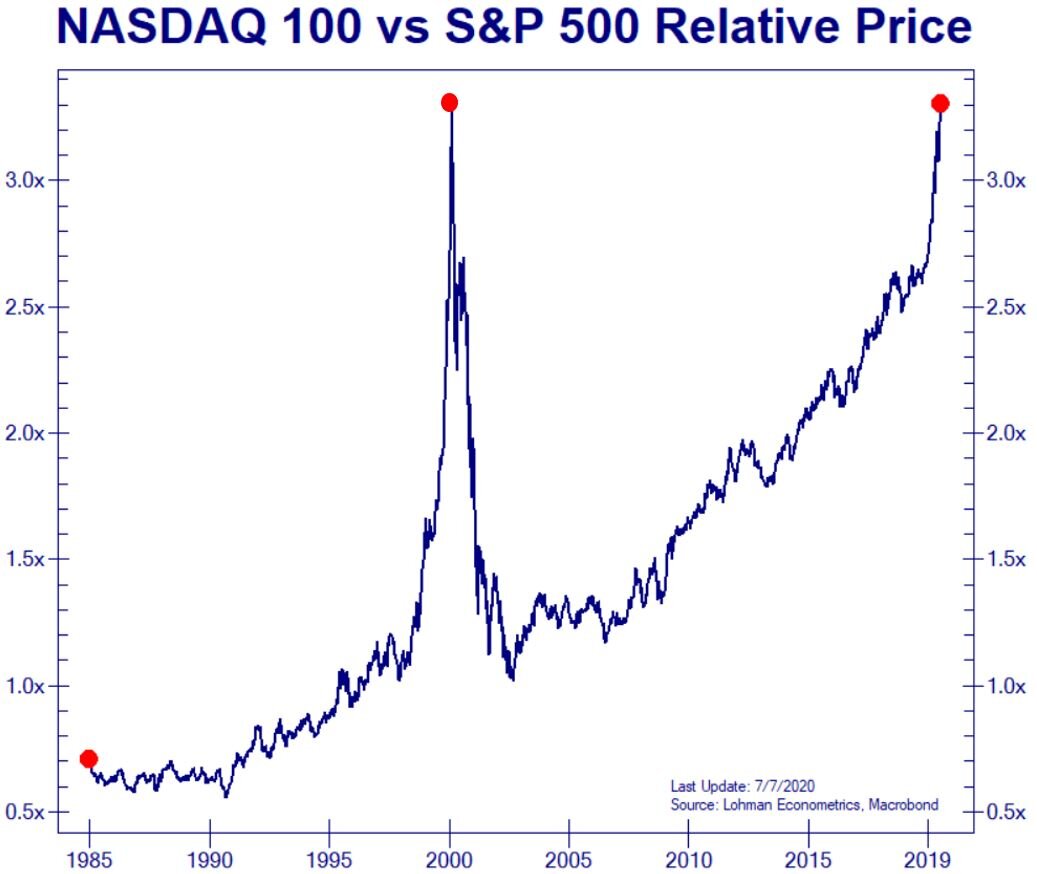
The NASDAQ 100 index is a good proxy for domestic, large-cap, growth, tech companies. The “Super 6” in the first chart in this section make up nearly 50% of this index. In H1, this index was up 16.3%, while Microsoft was +29.8%, Apple +24.9%, Amazon +49.3%, Alphabet +5.8%, Facebook +10.6%, and Netflix +40.6%. The massive relative outperformance of large-cap tech isn’t just a recent phenomenon, but it has been running since the depths of the dotcom bubble hangover. In early July we saw the ratio of the price of the NASDAQ 100 index to the price of the S&P 500 index (which also includes the Super 6, but at ‘only’ a quarter or so of the index) surpass the levels from the peak of the dotcom bubble (March 2000). Fortunately, NASDAQ valuations are more reasonable than they were in March 2000, but are still expensive. Microsoft’s trailing 12 month price to earnings ratio (TTM PE) is approximately 35x, Apple 30x, Amazon 150x, Alphabet 31x, Facebook 33x, and Netflix 110x.
We pay much more attention to valuations and fundamental analysis than to price charts (technical analysis), but both are pointing to poor expected returns from domestic, large-cap, growth, and tech stocks over the coming decade.
Although we were underweight these domestic, large-cap, growth, tech stocks, our investment strategies were able to generate between 80% and 85% of our benchmarks’ returns this past quarter. And while bonds weren’t the place to be in this “risk on” market, our corporate bonds (Vanguard Short-Term Corporate Bond, VCSH, +5.8%; iShares ESG 1-5 Yr Corporate Bond, SUSB, +5.0%) and inflation protected treasuries (Schwab US TIPS, SCHP, +4.4%; Vanguard Short-Term Inflation-Protected Securities, VTIP, +3.0%) did well relative to the fixed income benchmark. Our developed market equity funds were among our relative disappointments, including our Singaporean (iShares MSCI Singapore, EWS, +9.4%) and international real estate (Vanguard Global ex-US Real Estate, VNQI, +8.7%) funds. Within domestic equities, our best performer was, surprise, surprise, a tech sector fund (Fidelity MSCI Information Technology, FTEC,+31.5%), which we hold in our more aggressive strategies. Our domestic equity underperformers were large-cap value (Vanguard Value, VTV, +12.7%; Nuveen ESG Large-Cap Value, NULV, +14.3%) and growing dividend (e.g. quality) equities (Vanguard Dividend Appreciation, VIG, 13.9%).
For H1, our more aggressive strategies matched or narrowly bettered their benchmarks, while our more conservative strategies came up shy. Our strategies benefitted from being underweight equities/overweight fixed income during this period, however the make-up of our investments within these broad asset categories could have been better. Within equities we were hurt by our heavy mix of international holdings. And within fixed income, we were held back by our heavy mix of shorter duration bonds during a period of collapsing yields.
OUTLOOK & STRATEGY POSITIONING
In this quarter’s Outlook & Strategy Positioning section, I thought I would delve into our strategies’ fixed income positions, and in particular, their short-duration and heavy exposure to inflation-protected Treasuries. Both qualities are predicated on our belief that the market may be underestimating either the possibility of higher inflation rates and interest rates (both tend to move in lockstep), or the magnitude of those higher rates, going forward.
First, what is duration and what are inflation-protected Treasuries? Duration is a measure of the sensitivity of a debt instrument’s price to a change in benchmark interest rates. There are several types of duration measurements, but the common key thread among them is that the higher the duration, the higher the debt instrument’s price sensitivity, and vice versa. I’ll use the effective duration measure going forward, which is given in years. A rough estimate of the price reaction to a 1% change in interest rates is -1% for each year of effective duration. For example, a 1% rise in interest rates would cause a 5.8% or so decline in our fixed income benchmark, the Bloomberg Bloomberg Barclays Capital US Aggregate Bond Index, because it has an effective duration of 5.8 years. The average effective duration of our strategies’ fixed income holdings ranges from 3.7 to 3.9 years. So bottom line, our fixed income holdings will fair better than our fixed income benchmark in a rising interest rate environment, but worse in a stable to declining interest rate environment — all else held constant.
Inflation-protected Treasuries, or TIPS, are US Treasury bonds that are indexed to inflation. They receive interest just like plain vanilla bonds, but their differentiating quality is that their principal is adjusted by the rate of inflation, in this case the Consumer Price Index (CPI). So let’s say you have $100 in TIPS with a 1% coupon rate and CPI runs at 3%. Over a year you’ll get 1% in interest received over two semi-annual payments (~$1 total) and a $3 upward adjustment to your principal — leaving you with $104 in value at year’s end. So bottom line, this type of bond does better than plain vanilla bonds when inflation runs higher than the market expects, all else held constant. Approximately 25% of our strategies’ fixed income holdings are of the TIPS variety, whereas our fixed income benchmark does not include any TIPS.
Now on to why we believe that the market may be underestimating the probability and/or magnitude of higher inflation in the US in the years to come — the recent surge in the M2 money supply caused by the US government’s monetary and fiscal stimulus programs.
M2 is a measure of all cash in circulation, checking accounts, savings accounts, money market funds, and time deposits (e.g. CDs) — basically liquid assets that can be used to buy things with short notice. Along with assets, it is an important determinant of inflation — after all, prices change (i.e. inflation or deflation occurs) when there is a temporary imbalance between money and assets. In a free market, prices change to keep the balance between supply and demand. When there is a sudden surge in money (i.e. M2) relative to assets, inflation kicks in to “stabilize” the situation. Or when available assets shrink (think destruction from a natural disaster) and money is unchanged, inflation also appears. Likewise, deflation occurs when the opposite happens.
Below is a chart that shows M2 growth year-over-year (see blue line, right axis). Stimulus checks, state and federal enhanced unemployment checks, PPP loans (which will mostly be forgiven), and some Fed quantitative easing contributed to a 25% spike in funds of American individuals and companies that are available to spend on stuff (assets). This would normally result in a spike in prices, but hasn’t now because of the stay-at-home orders, consumers’ fears about contracting COVID-19 while shopping, and businesses’ uncertainty about the future. All of this newly created M2 is sitting in checking and savings accounts, CDs, and money market funds, waiting for the all-clear siren to sound. The velocity of M2 (see maroon line in the chart, left axis), the rate at which the money changes hands over a given time period, is expected to collapse in the near term (chart’s M2 velocity data only goes through January). However, if the pandemic ends in a reasonable short period of time, as equity markets appear to assume, we should see some of the M2 be put to use (i.e. M2 velocity increase). In 2021 or 2022, should we get back to some form of post-COVID economic normalcy, we may see a spike in inflation in order to bring the 2020’s large increase in M2 and 2021/2’s expected increase in M2 velocity into balance with the relatively fixed level of available assets.

We have had large government stimulus programs and low interest rates during much of time since the 2007-2008 global financial crisis (GFC), and they didn’t generate excess inflation as many had feared. But what is different between then and now is the nature of the stimulus, and how it translated (or didn’t) into M2 growth. The big US government bailouts and interest rate cuts during and after the GFC didn’t really impact M2. Instead, most of the funds ended up in banks’ excess reserves and never got lent out to individuals and companies to spend. Low rates usually drive more spending and investment (because of lower hurdle/breakeven rates), but after the GFC the banks only extended loans at these low rates to individuals and companies which didn’t need to borrow. Those without the capital to pay for an expenditure out of pocket weren’t offered loans, generally speaking. We saw a brief blip up in M2 growth in 2009, but it was neutered by a collapse in M2 velocity, and then followed up by lackluster growth in 2010. This contrasts with today in that government stimulus has bypassed the banks and gone straight into the pockets of individuals and companies to spend as and when they choose.
Another potential driver of inflation going forward is the breakdown of international supply chains caused by rising tariffs and other restrictions on imported goods into the US. The rise in international trade, particularly the trend of outsourcing of manufacturing to low cost countries like China, Vietnam, and Mexico, put significant downward pressure on consumer prices over the last thirty years. This tailwind for consumers recently flipped directions, caused by the trade wars initiated by the Trump administration. Even should Democrats sweep in November, we believe that the damage to the US’s reputation as a reliable and fair trading partner will be long lasting.
One aspect we like about this short duration, heavy TIPS positioning is that we don’t have to have much inflation for it to work. Right now the market is pricing in only 1.25% average annual inflation over the next five years, and only 1.41% over the next decade — well below the 1.75-2.5% range we experienced most of the last 20 years.