
View a downloadable version of this blog entry »
INVESTMENT ENVIRONMENT1
Source: Orion Advisor Services, AlphaGlider
After an aggressive selloff in the last quarter of 2018, global equity markets came back strongly in the first quarter of 2019. The US equity market, as reflected by the S&P 500 Index,^a rebounded an impressive 13.7% in Q1, retracing all and more of the 13.5% decline it suffered in Q4. Foreign equity markets were also up strongly in Q1, with both developed and emerging markets up approximately 10%. The US bond market also had a strong quarter, with the broad-based Bloomberg Barclays US Aggregate Bond Indexe up nearly 3%.
In an ironic twist, the weakening global economy that triggered Q4’s equity selloff was also the underlying driver behind Q1’s dramatic rebound. Economic data was softening during Q4, but remained strong enough for the Federal Reserve (Fed) Chair Jerome Powell to reiterate, in mid-December, the Fed’s intention to continue its balance sheet reduction program and to guide to two rate increases in 2019 (down from three in prior guidance). But only three weeks later, Powell made a major about-face. He signaled that the deterioration in domestic and international economies, combined with the looming threats from falling equity markets, a prolonged US government shutdown, escalating trade tensions between the US and China, and a chaotic, unprepared United Kingdom (UK) exit from the European Union (EU), warranted a cessation in rate increases and balance sheet reductions. With the “Fed put” exercised, risk assets around the globe rallied strongly for the remainder of the first quarter.
President Trump’s frequently and aggressive criticism of Powell and the Fed for tightening monetary conditions in 2018 raised concerns over Fed independence within the financial community. These concerns were heightened by the Fed’s sudden and unanticipated policy reversal in early 2019, and again recently by Trump’s proposed nomination of Herman Cain and Stephen Moore to the Fed’s board of governors. Both nominees are vocal supporters of Trump and recently of Trump’s call for lower rates, easier money, fewer consumer protections and bank regulation, and both have questionable education and work experience for the role. Powell has repeatedly denied that the Fed is kowtowing to Trump, but now there appears to be little difference between the Fed’s argument that rates need to be held low because the economy is faltering, and Trump’s view that rates need to be held low because the economy is so strong.
Independence from partisan political pressures is important for the integrity and credibility of any central bank, but especially so for the Fed because of the dollar’s role as the global reserve currency. The list of potential negative unintended consequences of politicized central bank decision making is long, but the one that is most concerning to the financial community is elevated inflation caused by overly accommodative monetary policies.

Source: Capital Economics
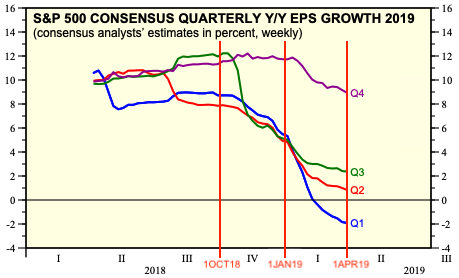
Getting back to the weakening global economy, the chart to the right shows four different economic indicators turning south. Much of the global weakness is emanating from Europe and Asia, but its effects are being felt in the US (after all, 43.6% of S&P 500 revenue came from overseas last year). The chart below tracks quarterly S&P 500 earnings per share (EPS) estimates for the four quarters of 2019, over time. While analysts are usually overly optimistic in their initial earnings estimates, and eventually revise them down over time, the downward revisions over the last six months have been greater than usual. For example, analysts were calling for nearly 9% growth in 1Q19 EPS as recently as October 1, 2018, but are now predicting a 2% decline. Their full year 2019 EPS growth estimate is now down to a modest 3.3%.
Source: Yardeni Research, AlphaGlider
Job growth in the US was volatile in Q1, due in part to Trump’s 35-day federal government shutdown. February’s job growth number was only 33,000, but rebounded to a more normal value of 196,000 in March. Wage growth continues to creep up (3.2% year-on-year in March), but is still lower than expected given the historically low 3.8% unemployment rate.
March was supposed to be the month of reckoning for both US-China trade and Brexit negotiations, but in both cases the can was kicked down the road. US-China trade negotiations made sufficient progress to prompt Trump to remove his threat to raise tariffs from 10% to 25% on $250 billion in annual Chinese imports. On the Brexit front, the UK asked for, and was granted by the EU, two Brexit extensions, first to April 12, and then to October 31. At this point, it’s anyone’s guess how US-China trade and UK-EU Brexit negotiations will evolve, or devolve. With both situations difficult to analyze with any glint of certainty, it would appear that investors have just chosen to ignore them until more concrete information is available.
PERFORMANCE DISCUSSION
With markets in full risk mode, AlphaGlider strategies were only able to capture about three-quarters of their respective benchmarks’ gains during the first quarter. The single largest factor behind our strategies’ relative underperformance was their underweight position in equities. On average, our strategies were underweight equities by approximately 15% relative to their benchmarks.
Another important contributor to our strategies’ underperformance was their overweighting of international equity markets relative to the more strongly performing US equity market. Our strategies were also held back by their defensive positioning within US equities, such as Fidelity MSCI Health Care (FHLC, +8.1% during Q1), Vanguard Consumer Staples (VDC, +10.7%), Vanguard Dividend Appreciation (VIG, +12.0%), and SPDR Portfolio S&P 500 Value (SPYV, +12.2%) — all below the S&P 500’s +13.7%. On a positive note, our more aggressive strategies’ position in Fidelity MSCI Information Technology (FTEC) was up over 20% during the quarter.
With the Fed’s change of heart on the economy that led it to put rates on hold, interest rates fell across the duration spectrum. This in turn drove up most bond prices, especially those of longer duration which are inherently more sensitive to interest rate changes. AlphaGlider strategies’ bond holdings were skewed to the shorter end of the yield curve, and thus fell short of our benchmarks’ bond proxy, the Bloomberg Barclays US Aggregate Bond index (+2.9%).
Our strategies’ worst performing fund during the quarter was the Vanguard Market Neutral Fund (VMNFX), which was down 5.25%. We purchased this cash proxy several years ago when cash and other short-term deposits were yielding next to nothing. Now that short-term rates are north of 2%, we are considering exiting our VMNFX position.
OUTLOOK & STRATEGY POSITIONING
With the US equity market outperforming its international peers this past quarter, and in six of the last seven calendar years, I thought it would be a good time to remind my readers about the importance of diversification, valuation, and reversion to the mean to long-term investment returns.
First, diversification. In it most simple form, diversification is about not putting “all of your eggs in one basket.” That is to say, it is easier to lose everything if you are invested in only one asset than if you spread out your investments over many assets. Diversifying one’s investment portfolio is the equivalent of storing your eggs in multiple baskets, spread out across your home, your relatives’ homes, and even a few in your bank’s vault.
But there’s a more nuanced benefit of diversification, one that American economist Harry Markowitz first explained in in a Journal of Finance paper he published in 1952. In this paper, which would later earn him the Nobel Prize in Economic Sciences in 1990, Markowitz developed the modern portfolio theory (MPT). The theory proposed that one can assemble a portfolio of assets that maximizes expected returns at a given level of risk. The graphic representation of this theory is shown on the chart below.
Source: AlphaGlider
The dots on the chart represent individual assets (or asset classes if you so choose), and the position of each dot shows the asset’s expected return and risk level as measured by its volatility (i.e. standard deviation). Markowitz found that by making combinations of thecassets, one can build optimal portfolios that maximize expected returns at a given level of risk. These optimal portfolios are represented by the efficient frontier curve in the chart and are effectively made up of the entire universe of investments, asset-size weighted (so extremely diversified). Note that each optimal portfolio on the efficient frontier has a higher expected return than any individual investment with the same expected risk. There are many books and university classes dedicated to MPT and this very chart, but the key I would like you to take away from this brief discussion is that diversification allows an investor to get a higher return without increasing risk taken. This is the “free lunch” that is often referenced in discussions of diversification, and of MPT.
With hindsight, one can always pinpoint a mono-asset portfolio that outperformed all diversified portfolios, including those that fall on the theoretical efficient frontier. Owning US stocks exclusively this past quarter is an example of this. The problem with hindsight, of course, is that it is never obvious until after the fact. Trying to predict which assets or asset classes are going to perform best next quarter, or over the coming year, on a somewhat consistent basis, is difficult. There are no methods, to my knowledge, that allow one to pick short-term winners. And even if a method to beat the market over short-term were to emerge, it would be quickly copied by others to the point that the “advantage” would be competed away. It is only over long time periods that some investment analysis techniques have proven to be useful in predicting, with moderate probabilities of certainty, which assets and asset classes will out-perform. Fortunately for us, it is difficult for most investors to successfully execute on these techniques, and thus the advantage they provide are not competed away.
The reasons that most investors do not have the discipline to apply these techniques are many, but I believe the two most important are emotions and career risk. We are inherently emotional beings, subject to frequent bouts of fear, greed, jealousy, and impatience. The ability to control these emotions, particularly in times of extreme market conditions (both good and bad), is a rare. But even if your portfolio manager has this quality, their employer or their client (i.e. you), may not, and thus hire and fire the portfolio manager at exactly the wrong times. Buying low and selling high requires consistent patience and emotional control over the investment cycle by all three players — your portfolio manager, their employer, and you, the client. See my On Being Contrarian blogpost for more discussion on emotion and career risk in investing.
Now on to the importance of valuation on long-term investment returns — actually, come back to the importance of valuation. You see, it’s valuation that is at the core of the investment analysis techniques that have predictive power over long time horizons. And it is the confidence that these techniques will continue to be predictive going into the future that gives long-term investors better control over their emotions. See my Long Time Horizons blogpost for more discussion on valuation.
Finally, what is reversion to the mean (aka mean reversion) as it applies to investing, and why is it important to long- term returns? Mean reversion is a commonly observed phenomenon that returns, valuations, and other such metrics tend to fluctuate around a long-term average level. Another aspect of this phenomenon is that that the larger the current deviation of the metric from the long-term average, the more likely that subsequent returns or changes in valuation will be in the opposite direction, thus returning the metric to its long-term, average state. One relevant observation of reversion to the mean is in the price movements of the US equity market relative to that of other developed equity markets, as shown below. Notice that between 1950 and approximately 2012, a period of 62 years, the average returns of the US and developed international equity markets were identical. Mind you, there were long periods of relative outperformance for developed international equities (1956-1960, 1967-1988, 2002-2007), and long periods of relative outperformance for US equities (1960-1967, 1988-2002). The 1960s run in the US equity market was driven by the price insensitive rush into large, growing blue-chip companies, the Nifty 50 (e.g. Eastman Kodak, GE, IBM, McDonalds, Xerox, etc). The resulting valuation premium, combined with the disruption of the Vietnam war, runaway inflation (deja vu: Nixon pressured the Fed to keep rates low to aid his re-election campaign), and an OPEC-induced energy crisis led to a long period of mean reversion, and then mean overshooting, in favor of developed international equities. By 1988, many investors were convinced that Japanese companies would dominate the global economy, and that America’s best days were behind it.

Source: BofA Merrill Lynch, AlphaGlider
The 1990s US equity market outperformance came out of low relative valuations (ridiculously high Japanese company valuations), the peace dividend from the end of the Cold War, and eventually a frenzied crowding into internet stocks which more times than not, US-based. By 2000, many investors were convinced that the internet had changed everything, and no price was too high to get on board. But then the bursting of the tech bubble and the economic drag from wars in Iraq and Afghanistan allowed developed international equity markets to outperform its US peer.
Markets go and up down relative to one another over time, usual driven by fundamentals, but sometimes by false assumptions that short-term trends are long-term trends. Investors get caught up by their emotions and forget the strength of capitalism’s “invisible hand,” and its heavy role in mean reversion. After each investment bubble and each overly pessimistic period, investors vow that they won’t follow the herd into the next one. But emotions, career risk, and the entrance of new investors who haven’t yet experienced a bubble or its bursting, always reemerge to create the next major deviation from the mean.
The US equity market appears to be in another one of these situations at the moment. As the chart on the previous page shows, the US equity market value exploded relative to that of developed international equity markets coming out of the depths of the Great Recession, helped by earlier and more aggressive central bank quantitative easing, weak wage inflation causing operating profit margins to expand, larger corporate tax cuts, and investor enthusiasm for large American tech stocks such as Facebook, Apple, Amazon, Netflix, and Google (so called FAANG). The value of the S&P 500 (US equities) more than quadrupled between the recession’s trough and March 31, 2019, whereas MSCI ACWId (developed and emerging market equities) merely doubled. The ratio of the value of US equities to foreign developed equities (normalized at 1.0x in 1950 and last passing through 1.0x in 2011) is now north of 2.0x. The current ratio is well above the previous peaks of 1.65x reached during the Nifty 50 bubble and 1.35x during the tech bubble. Collectively, investors believe that “this time is different.” They believe Trump’s lower corporate tax rates are sustainable for decades to come, that US corporate margins will not mean revert, and that the FAANG companies will always dominate their global competition.

Source: multpl.com, AlphaGlider
Another mean reverting valuation metric that has us concerned about future US equity returns is the cyclically adjust price to earnings (CAPE) ratio (see above). Like with the ratio of US to developed international equity market prices, the US equity market CAPE peaked during the Nifty 50 and tech bubbles, and is currently at levels only exceeded once briefly during the exuberance of the tech bubble (see below). As the chart below shows, long-term (10-year annualized) price returns from those periods of extremely high CAPE ratios did not turn out well for US equity market investors. S&P 500 positions started in the late 1960s (Nifty 50) went sideways over the subsequent 10 years. Positions started in the late 1990s (tech bubble) did even worse, posting negative average annualized returns over the following 10 years.

Source: AlphaGlider, Yahoo Finance, S&P, Robert Shiller
Valuation and mean reversion are powerful forces over time, and ones we take seriously. Currently, both are pointing toward another extended period of disappointing returns from US equities.
I hope this discussion gives you a better understanding of why AlphaGlider strategies will always be diversified, and how we use valuation and reversion to the mean analyses to position our strategies to outperform their benchmarks over the long-term.