
View a downloadable version of this blog entry »
INVESTMENT ENVIRONMENT1

Source: Orion Advisor Services
During the fourth quarter of 2016, global investment markets movements were largely dictated by the outcome of the US presidential election. Donald Trump’s victory caused US equity markets and the US dollar to rally, while global bond yields spiked dramatically (bond prices fell) and foreign equities struggled.
Pollsters had Trump as the underdog, but the bigger surprise was the direction and magnitude of the markets’ reaction to the victory. As we highlighted in previous CIO commentaries this year, and demonstrated by the cover of Barron’s magazine during the primaries, conventional wisdom had it that a Trump victory would trigger a drop in US and foreign equity markets and in the US dollar, while causing US bond yields to decline. Only the fall in foreign markets came about as popularly prognosticated, and now Trump is considered to be positive for the US equity market. Yet another lesson that forecasting the short-term is tricky business.

Source: Barron’s, 15FEB16 & 12DEC16 Front Covers
US equities, as measured by the S&P 500, rose nearly 4% during the quarter on optimism that corporate earnings growth would accelerate due to Trump’s pledges to reduce corporate and individual tax rates, reduce corporate regulations, and increase fiscal stimulus in the form of increased spending on public infrastructure and defense. However, there was an especially large dispersion of returns across the various sectors that make up the US equity market.
The financials sector was up most during the quarter, nearly 20%, despite Trump’s strong criticism of Wall Street during his campaign. In addition to benefitting from lower corporate taxes and higher interest rates, financials are expected to benefit from Trump’s dismantling of numerous initiatives put in place after the most recent financial crisis to protect consumers and lessen the risk and severity of future bank crises, such as the Dodd-Frank Act, the Consumer Financial Protection Bureau, and the Department of Labor’s Fiduciary Rule. Goldman Sachs (ticker: GS) was the big winner within the sector, up 50%. Its former alumni and lawyers landing five major appointments in the Trump administration (Steve Bannon-Chief Strategist, Steven Mnuchin-Secretary of the Treasury, Gary Cohn-Head of the Council of Economic Advisors, Jay Clayton-Chairman of the Securities Exchange Commission, Dina Powell-White House advisor). On the other end of the spectrum were the US real estate, health care, and consumer staples sectors, all turning in negative returns during the fourth quarter. Real estate was hit due to its sensitivity to interest rates (rising rates hurt), health care due to its large exposure to international markets and uncertainty created by the expected repeal of the Affordable Care Act, and staples due to its inherent defensiveness.
With the prospect of rising US government budget deficits (a result of rising expenditures on infrastructure and defense, and declining tax revenue) during a time of low unemployment and rising wages, inflation expectations spiked after the election. As inflation expectations go, so usually go bond yields. The yield on the 10-year Treasury rose over 60 basis points since the election, as shown below:

In December the Federal Reserve (Fed) raised rates 25 basis points to a range of 0.5% to 0.75%, and projected three to four more rate increases in 2017, up from two in its September forecast.
With higher realized and expected US interest rates, demand for the US dollar rose relative to nearly all foreign currencies. The trade weighted US dollar broad index exited 2016 near its 2002 peak.
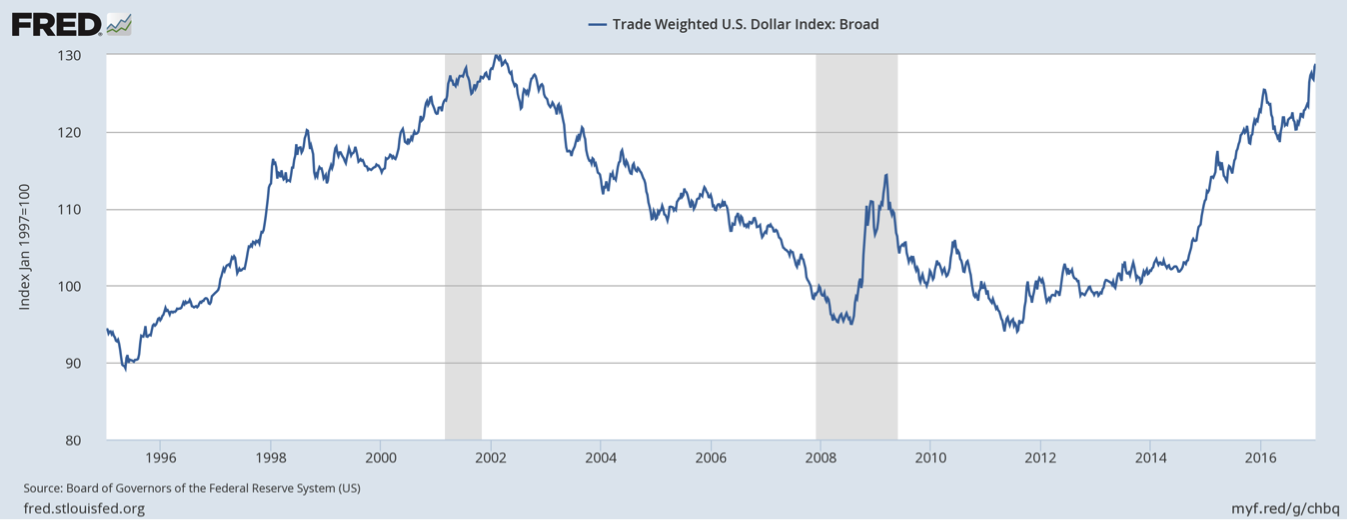
Source: Board of Governors of the Federal Reserve System, St. Louis Fed

Source: Bureau of Labor Statistics, Bloomberg
Moving overseas, the European Central Bank (ECB) extended its quantitative stimulus program by nine months, to the end of 2017, albeit at a lower €60 billion per month rate, down from the previous €80 billion per month rate.
Meanwhile, the United Kingdom (UK) continued to prepare in private for upcoming negotiations with the European Union (EU) over its exit (the so-called Brexit) from the economic and political bloc. The UK is expected to invoke Article 50 in late March, setting off a two-year negotiation period over the terms of the exit and its future relationship with the EU. As was the case three months ago, it appears that the UK is looking at a “hard exit” from the EU, i.e. giving up full access to the European single market due to its preference to regain full control over its borders.
Looking forward into 2017, three major European countries have elections that could have significant impacts on their respective countries’ social and economic policies, and could threaten the existence of the EU: the Netherlands (15 March), France (23 April), and Germany (August-October). As with we saw in the US and UK during their 2016 political elections/referendums, there is strong and rising anti-establishment sentiment in these three European countries, as well as throughout the rest of the EU. Right-wing populist candidates in these countries have pledged Brexit-style referendums should they emerge victorious. With the UK planning to exit the EU in 2019, the EU is unlikely to remain a viable entity should either France or Germany decide to also leave.
The Organization of the Petroleum Exporting Countries (OPEC) surprised the market with its ability to agree on a 1.2 million barrels a day cut in production starting in 2017, and to convince 11 non-members to cut production by an additional 0.558 million barrels a day. Oil prices jumped on the news and have settled in at a level north of $50 per barrel. Saudi Arabia aggressively ramped production two years ago in an attempt to run high cost new entrants out of the market, most notably North American shale oil producers. While some of these producers did go bankrupt, most survived by conserving cash and successfully lowering their exploration costs. $50 oil, and a Trump-led rollback in environmental regulations, should continue to encourage many of these North American producers to expand exploration activities.

Source: Nasdaq
Source: The Daily Shot
PERFORMANCE DISCUSSION
AlphaGlider’s five strategies held up well against the volatility of the fourth quarter of 2016. With the fixed income portion of our benchmarks down nearly 3%, our underweight and lower duration positions in fixed income helped all of our strategies. Also benefitting our strategies were our underweight positions in developed international markets. The largest detractor to our strategies during the quarter was our underweight position in US equities.
Our most conservative strategy, AG-C (Conservative), outperformed its benchmark by nearly 200 basis points, but still finished slightly in the red in absolute terms. Our most aggressive strategy, AG-A (Aggressive), was up about two-thirds of a percent, narrowly trailing its equity-heavy benchmark.
AlphaGlider’s top fund performers during the quarter were two value-oriented US equity funds that maintain relatively high exposure to financial and energy companies, Vanguard Value (VTV) and Vanguard High Dividend Yield (VYM). Our Vanguard Market Neutral fund (VMNFX) also performed well. Our laggard funds included the Vanguard Health Care (VHT), Vanguard Emerging Markets (VWO), and our core US fixed income fund, iShares Core US Aggregate Bond (AGG).
Our strong performance during the fourth quarter couldn’t make up for the damage done to our strategies by the unexpected result of June’s Brexit vote. We were overweight Europe going into the vote, and then de-risked our strategies just as the equity markets rebounded. Our strategies also were hurt by our continued underweight positions in US equities, which once again was one of the best performing major asset classes (S&P 500 was up 12%). 2016 was the sixth year in the last seven in which the US equity market outperformed developed foreign equity markets.
For the year, all five AlphaGlider strategies increased within a relatively narrow band around 3%, underperforming their benchmarks.
OUTLOOK & STRATEGY POSITIONING
I recall emailing my old friends and colleagues at Janus Capital in October 2008 that I was very excited to be back picking stocks at the firm after a brief, and failed, attempt at retirement. Lehman Brothers had just filed for bankruptcy, the VIXf was going through the roof (>50), and global equity markets had halved since I left the firm the year before. I imagine there were more than a handful of investors losing sleep back then, but not I. I was rested, and fired up about all of the bargains that lay in front of me. It felt like a great time to put money to work, to take risks when others weren’t.
I tell this story because that investment environment seems like ages ago — and it has been. The current bull market started just a few months after I returned to Janus — eight years ago this March. It is already the third longest bull market in US history (the two bull markets to last longer were the eight-year and six-month run that ended in September 1929, and the nine-year and five-month run that ended in March 2000). The total value of equity in the S&P 500 now totals over $20 trillion, more than triple the $6.6 trillion level it stood at when this bull market began.
Bullishness appears to be plentiful in the US equity market right now, with the financial press giddily tracking the Dow’sg attempts to breach 20,000, and confident CEOs giving aggressive profit forecasts based on lower tax rates and government regulation, and fiscal stimulus they expect Trump to deliver. And if the VIX is anything to go by (it’s at near post-recession lows as I write this, 11.3), investors are relaxed about the environment we’re in. All of this makes me nervous. Now I’m the one losing sleep.
Duration alone has never killed a bull market, but overvaluation of assets, slowing economic growth, rising inflation, rising borrowing costs, a reduction in monetary liquidity, and rising political instability certainly have. Trump’s rise to the Oval Office may very well release the “animal spirits” that will drive the next leg up in the economy, and in turn the stock market. But maybe not. At this point, little is known about how Trump’s policy positions will eventually turn out. I sure don’t know. But what I do know is that the US market is priced richly, implying to me that many, if not most, of the upside economic scenarios of a Trump presidency are already priced in. What are not priced in are the downside scenarios, and thus the US market presents an asymmetric risk-reward opportunity, and not one of the favorable types.
I’ll get to some of those downside scenarios, but let’s first talk about current US market valuations, with updated prices and forward consensus projections post the “Trump bump.” The forward price-to-earnings (P/E) ratio of the S&P 500 exited 2016 around 17x, a level above the peak reached before the ’08-’09 recession, but only slightly above the 16.5x average since 1990.

Source: FactSet, Standard & Poor's, JP Morgan Asset Management
However, the S&P 500’s relatively benign forward P/E ratio may be misleading. Since around the turn of the millenium, US corporate profit margins began to break away from the fairly tight band in which they had traditionally resided, primarily at the expense of employee compensation (perhaps this is related to the rising populist sentiment in the US, but that’s a topic for another day). I’ve shown this relationship in previous quarterly commentaries as a percent of corporate revenues, but below right I show it as a percent of the country’s gross domestic product (GDP) since the late 1950s. Source: BEA, FactSet, JP Morgan Asset Management, AlphaGlider

Source: BEA, FactSet, JP Morgan Asset Management, AlphaGlider
And below is another chart that shows the interplay between wages and corporate profit margins, this time presented as a percent of the value-added component of GDP since the late 1940s.

Source: Jeff Gundlach, DoubleLine Capital

Source: Yardeni Research, Federal Reserve Board, Standard & Poor’s, AlphaGlider
Another valuation metric that is pertinent in a world of mean reverting profit margins is the cyclically adjusted price to earnings (CAPE) ratio. The CAPE deals with the volatility of profit margins by dividing the S&P 500’s price by its annual average of the last 10 years of inflation-adjusted earnings. Again, we find the S&P 500’s current valuation at an extreme level (27.7x exiting 2016), only exceeded by the peaks of the dotcom bubble and the bubble created in the late 1920s.

Source: multpl.com, AlphaGlider
It was these three valuation metrics on the two previous charts that excited me so much about the global equity markets back in October 2008. But now it is these same charts that are causing me to pull back from the US equity market.
And now I’ll move on to what could be the triggers to cause employee compensation growth to mean revert (up), in turn causing US corporate margins to mean revert (down). Actually, the reversion is already well in progress. Annual average hourly earnings growth has been accelerating since the beginning of 2015, reaching 2.9% year on year growth in December (see the Paychecks Get Bigger chart in the Investment Environment section). This wage inflation showed up, in conjunction with an erosion of corporate profit margins, in the two earlier charts that covered the historical relationship between wages and margins. Below is another telling chart showing this relationship.

Source: @CyrilRcube, AlphaGlider
I think that wage pressures on corporate profit margins are likely to increase going forward. We are now at close to full employment, the point at which companies usually need to lure away employees from other companies instead of picking them up from the unemployment line — and this usually entails the enticement of higher pay. With the employment picture so strong, employees have become less concerned about job security, and thus are more willing to risk rebuilding tenure at a new employer if the pay is right.
And now there is the Trump effect, which may put upward pressure on wages in at least three ways. First, if Trump is able to convince the Republican-controlled Congress to approve his massive $1 trillion infrastructure plan, then we will need many more skilled construction workers. However, most of them are already employed — again, the lure of wage increases will be needed to pull them away from their current jobs.
Second, Trump’s efforts to bring manufacturing jobs back to the US may put upward pressure to the wage expense line of affected companies. Instead of paying $5-$10 per hour in wages and benefits for factory workers in Mexico and China, companies may increasingly be on the hook for $20-$60 per hour American factory workers — and/or higher capital expenditures on automation. Those companies that continue to import goods produced in foreign factories may end up paying additional import tariffs if Trump’s threats come to fruition. Either way, costs look to increase for companies selling goods in the US. American consumers will inevitably share some of this though, in the form of higher prices, in other words, creating inflation.
And third, Trump’s plans to stem immigration, illegal or otherwise, will reduce the supply of low cost labor in the US, putting upward pressure on wages.
It’s unclear at this point how successful Trump will be in executing on his plans to boost spending on defense and infrastructure, his pledge to bring back manufacturing jobs to the US, and to restrict immigration, but they were all core pillars of his political platform and important issues to a majority of his voter base. Trump was elected on populist platform, so he will feel pressure to deliver. Wage pressure on corporate profit margins has been building for two years now, and we suspect it will continue into the foreseeable future, acting as a drag on earnings growth rates of US companies.
Related to rising wages is rising inflation, and in turn, rising interest rates. Higher rates equate to higher interest expense, putting direct pressure on profit margins of companies carrying debt, and raising the hurdle rate (minimum required return) on new growth projects financed with either debt or equity. Likewise, households are hurt by higher rates through higher interest payments on their home mortgages, car payments, school debt, and credit card balances.
Inflation and interest rates also have meaningful impacts on valuation multiples that investors used to value companies, with rising rates usually lowering valuation multiples. The logic goes that the value of a company is the net present value of its future free cash flows, and the discount rate applied to bring those cash flows back into present dollars is closely linked to current long-term interest rates. Below is a graphic that shows the average trailing P/E multiples applied to the S&P 500 in different inflation environments over its history.

Source: JP Morgan Asset Management, AlphaGlider
The massive drop in inflation and interest rates over the last 35 years (inflation was over 10% and the 10-year Treasury yield peaked near 16% in 1981; in 2016, inflation has been about 1.7% and the 10-yr hit an all-time record low of 1.37% in July) was the primary driver of the large expansion in P/E multiples over that time (<8x data-preserve-html-node="true" trailing earnings in September 1981 to 25x trailing earnings exiting 2016). By definition, this multiple expansion was what caused the value of the S&P 500 to grow more than three times faster than its underlying earnings. We have been coasting in the range of 1-3% inflation and central bank suppression of interest rates throughout most of this bull market — but that may be set to change with upward pressure on energy prices, wages, and product prices (a potential by-product of Trump’s plan to bring manufacturing back to the US through threatened or actual import tariffs and other protectionist trade policies), and a retreat from central bank monetary stimulus. Since the election we’ve seen a 60 basis point jump in the 10-year Treasury yield to 2.45%, a 75 basis point jump in the typical 30-year home mortgage to 4.32%, but nary a scratch to the US equity market. Rates don’t matter to the stock market, until they do…
Another risk to the US equity market is US dollar strength — a stronger dollar makes products and services produced in the US more expensive relative to those made elsewhere. It also depresses revenues and margins of US companies which export, or compete domestically against foreign companies. As the dollar chart in the Investment Environment section shows, the dollar is up nearly 5% against a trade-weighted basket of currencies of US trading partners since the election, and is up over 25% since mid-2014. One of the primary drivers of US dollar strength has been the widening gap between US interest rates and those of its trading partners. Many economists forecast this gap will continue to widen under a Trump administration that significantly ramps fiscal stimulus (via infrastructure and defense spending, and tax cuts), causing the dollar to strengthen further.
Risks to the US equity market that are more difficult to handicap, in both their probability and magnitude of damage, are future trade wars, and future armed conflict. Of course these risks are not new, but they would appear to be greater with Trump than with any previous president since the Cold War. Let’s start with trade.
Trump campaigned on the promise to kill the recently signed Trans-Pacific Partnership (TPP) trade deal, to renegotiate or terminate the North American Free Trade Agreement (NAFTA) with Mexico and Canada, and to get tough with China on “rebalancing” trade between the two countries by threatening 45 percent tariffs on Chinese imports. There was much hope within company boardrooms, both internationally as well as in the US, that Trump’s anti-trade rhetoric was merely a strategy to garner working class votes. And that when in office, Trump and the Republican-controlled Congress would follow a traditional Republican pro-trade agenda. However, that hope may have been misplaced. Trump has nominated three free trade skeptics to prominent positions on his nascent economic team: Robert Lighthizer as US Trade Representative, Wilbur Ross as Secretary of Commerce, and Peter Navarro to head up the newly created White House National Trade Council. Add these nominations to continued protectionist trade tweets by Trump, and we believe it prudent to consider the possibility of a debilitating trade war between the US and one or more of its major trading partners over the coming years.
As with trade, Trump has taken his shoot-from-the-hip mindset into the foreign policy arena, both during the campaign and after his victory. He has been especially aggressive in his comments, tweets, and actions over: the Iran nuclear deal; North Korea’s nuclear and missile programs; China’s island building in the South China Sea, One China policy, cyber attacks against US companies and government agencies, unhelpfulness in dealing with North Korea, and its unfair trade practices; and if US defense treaties and allegiances to long-standing US allies are worth upholding.
However the one major adversary that Trump hasn’t criticized to date, Russia, is the country that many foreign policy experts consider to be the western world’s most dangerous and destabilizing adversary at the moment. Meanwhile, Trump has created enemies within his own network of intelligence agencies, the network that presidents usually rely upon to make informed foreign policy decisions.
The international relationship that I think should most concern investors at the moment is the one between China and the US. It involves the two largest economies in the world, each heavily dependent on, and interconnected with, the another. After January 20th, both countries will be run by a nationalist populist who blames his country’s woes on the other country. And tensions between the two countries exist at multiple levels, from trade, to politics, to military, and escalating problems in any of these areas risks spreading to the other two.

Trying to accurately forecast a company’s earnings next year is difficult, but nothing like trying to assign probabilities and ramifications to various future geopolitical scenarios — so investors usually punt on analyzing their risks (and rewards), and including them in their valuations. But they do so at their peril.
It is pretty clear that the incoming Trump administration brings with it a wider than usual range of possible outcomes for the US economy, and for the value of the companies that operate within it. The scenarios at the positive end of the spectrum generally involve a reduction in taxes and regulations, and an increase in fiscal stimulus driving new life into an aged economic cycle, all the while keeping inflation, interest rates, and government deficits in check. Downside scenarios are a bit more fragmented in cause, but generally result in corporate margins and company valuation multiples reverting to their means.
Collectively, investors are currently paying $1.87 in S&P 500 equity for each dollar of revenue (refer back to the Stock Market Capitalization Ratios chart earlier in this section). This price would seem to imply that investors, again collectively, believe US companies are entering a new and lasting era of strong revenue growth and stable to expanding profit margins. Investors have only paid $1.87 or more for a dollar S&P 500 revenue at one other time in post-war history, the year leading up to the peak of the dot-com bubble. I was the technology and telecommunications analyst for the Artisan International (ARTIX) fund back then, so I vividly remember the arguments that the internet had propelled US (and foreign) companies into a new and lasting era of strong revenue growth and expanding profit margins. We all know how that ended.
I have no clue where the markets are going in the short-term. I wish there were analytical tools that could reliably generate investment alpha over the short-term, but there are none as far as I know. Fortunately the tools that we do use have been helpful, in a statistically significant manner, at delivering investment alpha over the long-term (7-15 years). But because of the random nature of returns in the short-term, these tools require substantial discipline and patience to execute, both on the part of the investment manager (myself), and the end client (you). Now is one of those times, as our tools have led us to underweight the strongly-performing US equity market over the last couple of years.
We view our positioning over these past few years similarly to how we view home insurance. Most years you end up paying your insurance premiums, but never have any problems that require an insurance claim. But that doesn’t mean that your insurance wasn’t worth it, or that you should do without it in the future. My wife and I bought a mountain vacation home in 2002 and dutifully paid our home insurance premiums year in and year out without ever needing to make a claim. Until we did, in 2014. Our home was empty, the furnace failed, the pipes froze, and then burst. And then the house flooded. Badly.
I’m not predicting that the pipes on the US equity market will burst this year, or even in the years to come. Our crystal ball isn’t that good. But what I am saying is that the price to insure those pipes appears to be an especially good bargain at the moment. I may be losing some sleep because of high market valuations, but I eventually fall to sleep knowing that I am backed up with an insurance policy.
“The four most dangerous words in investing are:
’this time it’s different.’”