
Photo credit: AI generated with Google Gemini
INVESTMENT ENVIRONMENT1
Source: Orion Advisor Services, AlphaGlider
The third quarter of 2026 was punctuated by a rapid rise in energy prices and global interest rates, and a resumption in the rush into artificial intelligence (AI) related stocks. The 3.5% quarterly decline in our fixed income benchmark, the Bloomberg US Aggregate Index,^e was its worst since the dreadful year for bonds back in 2022. The global equity market, as measured by the MSCI ACWI IMI Index,d was able to eke out a 1.6% gain during the quarter, led by the AI-heavy US equity market which was up 2.2%, as measured by the S&P 500.a Emerging market equities fell slightly (-0.4%), after knocking out the lights in Q2 with a 24% gain, as measured by the MSCI Emerging Markets Index.c
Over the last 12 months, the global equity market returned nearly 17%, led by a 29% gain in emerging markets. After their poor showing this past quarter, bonds are now down nearly 2% over the last year.
With less than one month to go before the US midterm elections, persistent inflation, rising interest rates, and the general lack of affordability is dominating the national mood. Since the beginning of the year, prices on many high-profile products have skyrocketed for Americans, such as the rate on a 30-year fixed mortgage rate increasing 125 basis points to 7.5%, the average retail price for diesel increasing $1.75 per gallon to $6.20, and a $200 increase in the entry-level 13” MacBook Air to $1,299. The Federal Reserve’s preferred gauge of inflation, the Personal Consumption Expenditures (PCE) price index, was up 3.4% year-on-year in August (core PCE was up 3.0%), its 66th consecutive month to run above the Federal Reserve’s (Fed’s) 2% target.
Of course this isn’t just an issue for Americans—it’s also an issue for consumers of all nationalities. There are many drivers of the global affordability problem, but the four most pressing ones at the moment are: 1) the wars in Iran and Ukraine, 2) AI infrastructure buildout, 3) expanding government deficits, and 4) Trump’s tariffs. Let’s take these one by one:
First, the wars in Iran and Ukraine have removed substantial supply of crude oil and gas from the global market, pushing up their prices. The wars have also damaged or destroyed numerous oil refineries and fertilizer production facilities in the two regions. Diesel production has been hit especially hard, triggering a secondary wave of inflation for nearly every physical product due to its importance in powering truck and train goods transport as well as farming machinery.
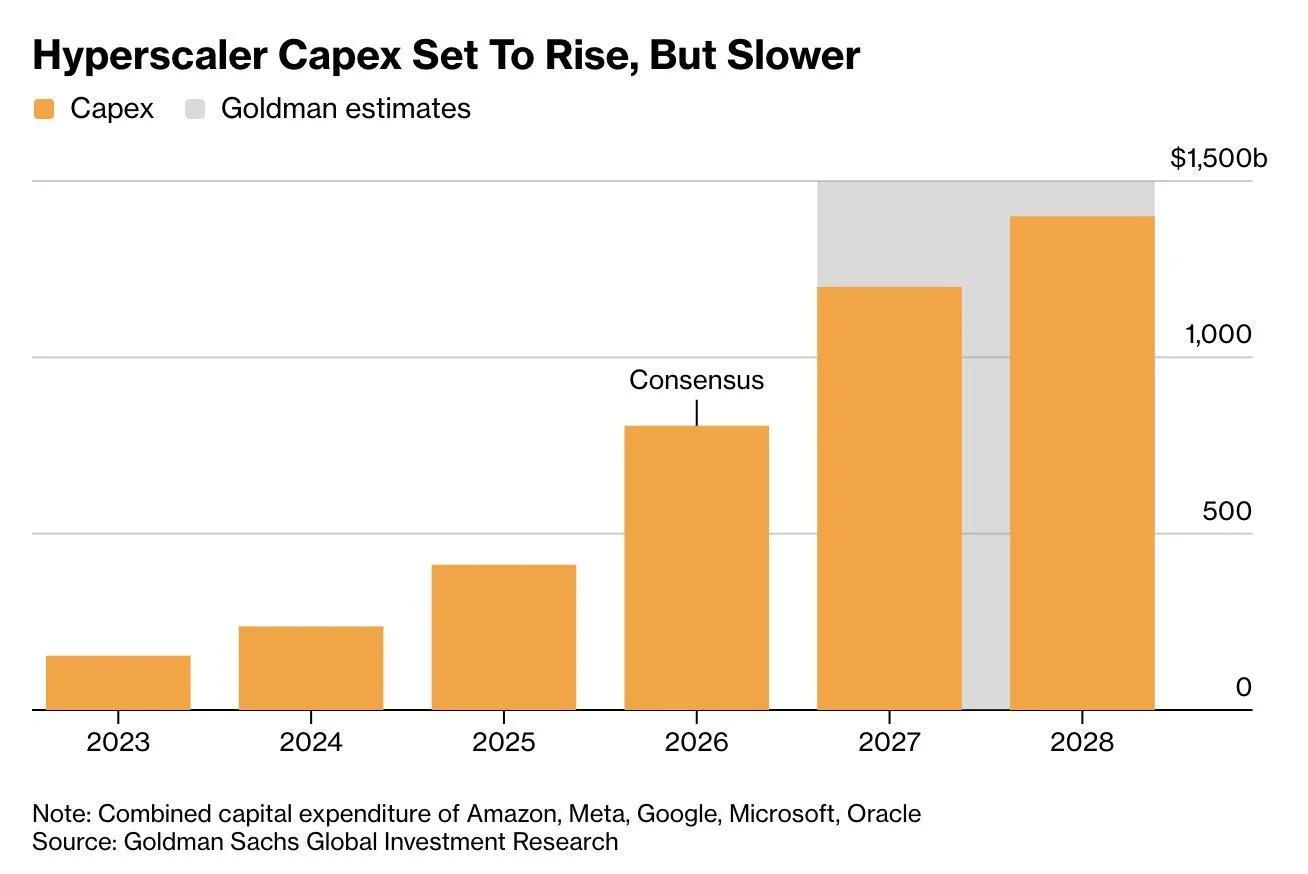
Second, the speed and scale of the AI infrastructure buildout is truly mind-boggling. Capital expenditures by the five largest hyperscalers (Amazon, Microsoft, Google, Meta, Oracle) barely cracked $100 billion when OpenAI unleashed ChatGPT on the world in 2022, but are now forecast to blow past $1 trillion in each of the next two years.
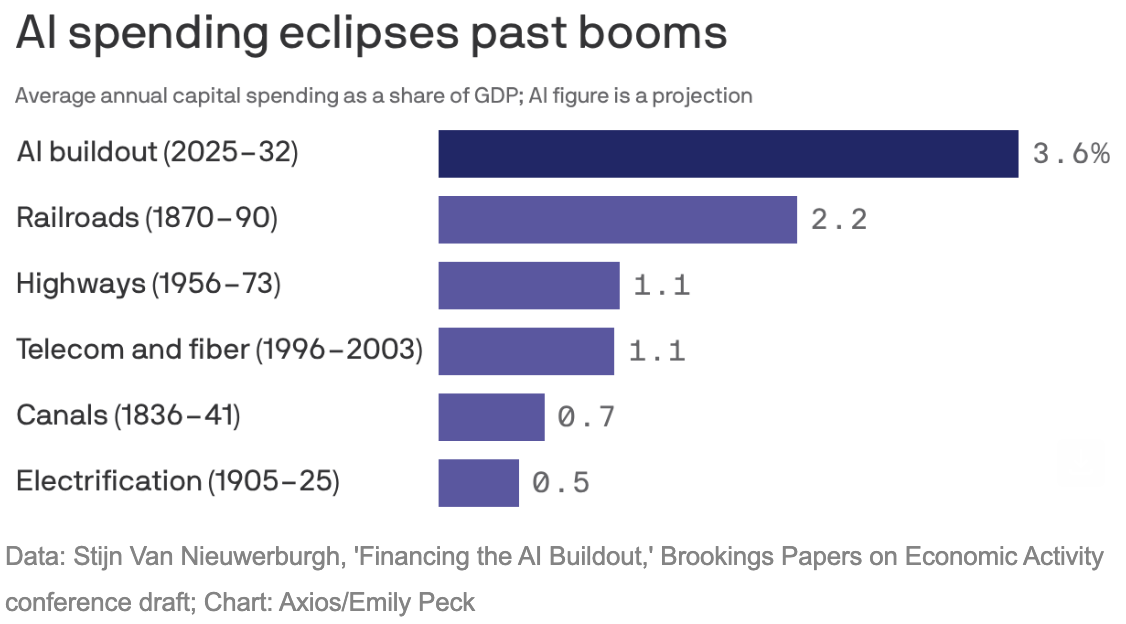
These numbers can be hard to get your head around, so for some perspective, the chart on the right shows the annual spending on the great technology buildouts over the last two centuries relative to the size of the economy at the time, as measured by GDP. Unsurprisingly, the construction and operation of AI data centers is driving up the price on many different types of products and services that both consumers and data centers require, such as computer chips and memory, electricity, and water.
The second major impact of this spending on AI has had on affordability is from interest rates. There is only so much money available in the world and when there is suddenly a new competitor needing it, the price of money (i.e. interest rates) goes up for everyone in the form of higher rates on credit cards, car loans, home mortgages, etc. At the moment, debt and equity holders of the hyperscalers feel that these AI investments will cover the higher cost of capital, but consumers and other businesses are increasingly unable to do so for some of their spending at these higher rates. This is known as the crowding out effect.
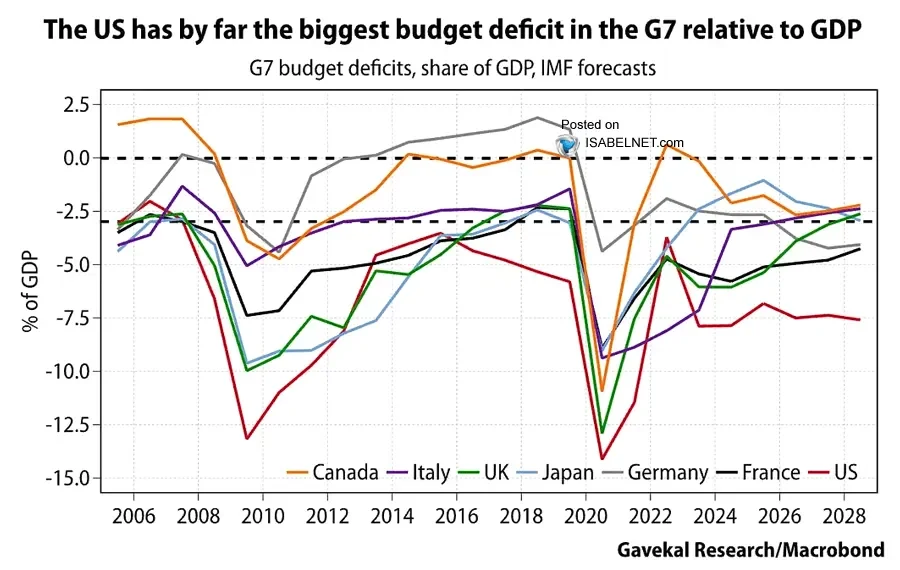
Third, the crowding out effect is also being spurred by the rise in government borrowing—this despite the strong global economy. This is especially true of the US even though it is among the fastest growing economies in the developed world. In the recently completed fiscal year, the US government looks to have raised $5.4 trillion in tax revenue, but spent $7.4 trillion. A little more than half (~$1.1 trillion) of this $2 trillion deficit was spent on interest on the debt, a figure that will continue to accelerate as rates and debt increase. US government debt held by the public is now 100% of GDP, a level last reached fighting World War II. The US is hardly alone in running high deficits, but it has been among the “worst offenders” during both good (now) and bad (e.g. Global Financial Crisis and Covid) times over the last 20 years, as shown below.
Fourth, but not least, Trump’s tariffs continue to directly drive up consumer prices in the US. Entering 2025, the US's import-weighted average tariff stood at 2.7%, and is forecast to hit 11.8% at year-end per a recent analysis by the Yale Budget Lab. This translates into ~$1,100 per year of inflation for the average American household.
Given this backdrop of persistent inflation, rising interest rates, and the public’s growing perception of a general lack of affordability in today’s economy, betting markets (per Polymarket) are giving the Democrats nearly 90% odds in taking control of the House in the midterms and a greater than 60% chance in taking the Senate, as shown below. The immediate economic and investment implications of a hypothetical Democratic sweep of Congress are somewhat muted though, as the Democrats are highly unlikely to garner the two-thirds majority in each chamber needed to override a Trump veto of its bills. It would appear that Trump’s tax and tariff agenda are with us for the next two years, but next month’s voting may portend what is to come in the 2028 presidential election.
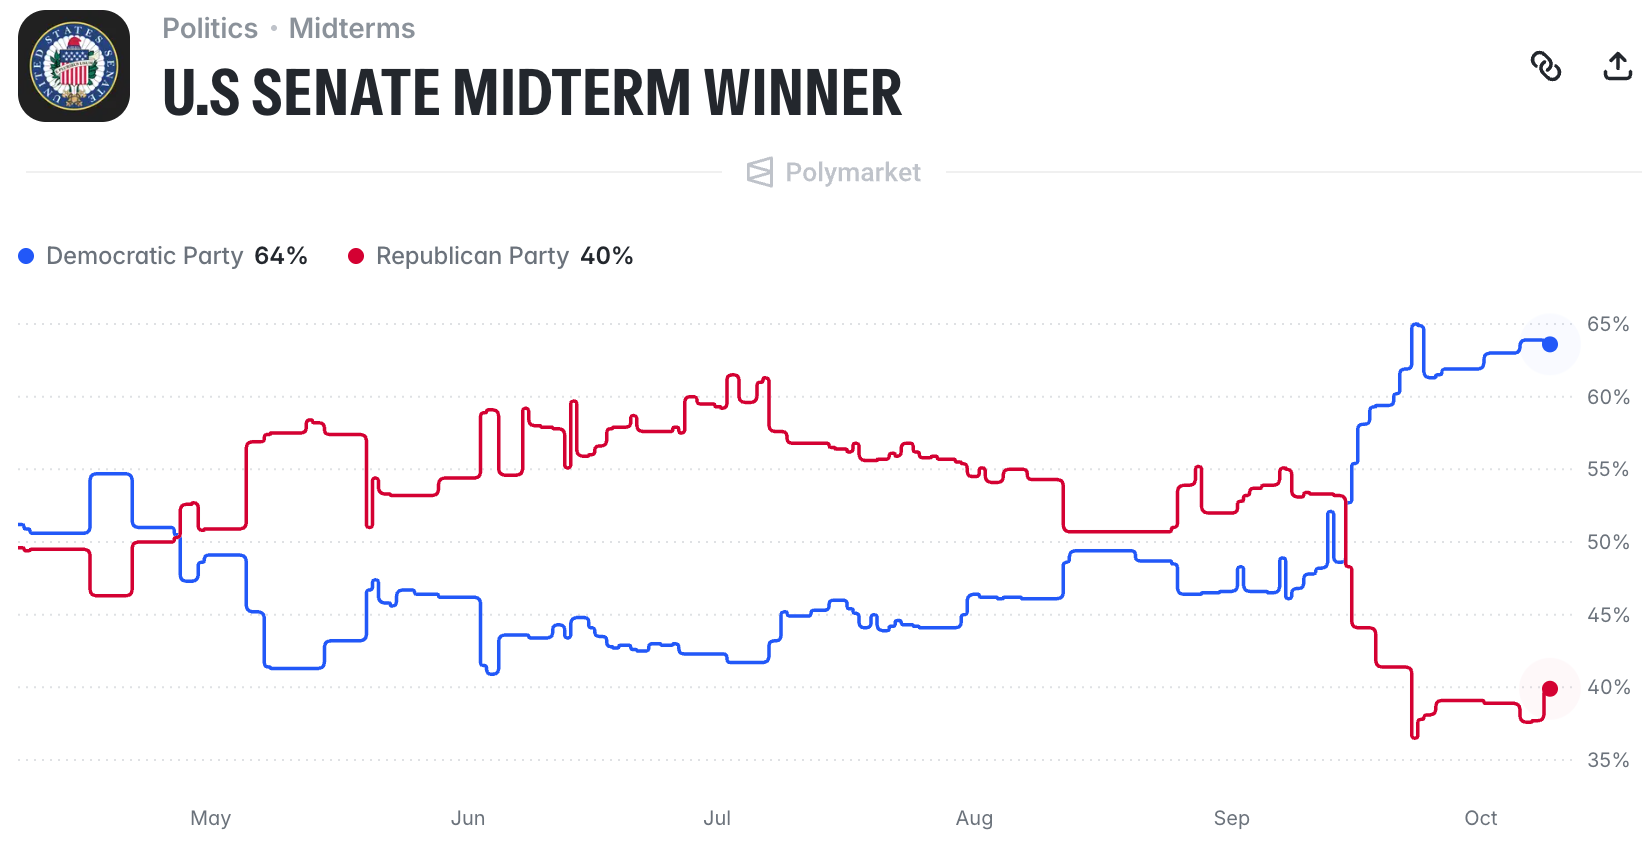
Source: Polymarket
The yield on the 10-year Treasury has increased over 100 basis points since the beginning of the year, to ~5.3% (see below). The market is telling us that the economy is running hot and could use some tapping on the brakes by the Fed. The Fed did just that in mid-September, raising its overnight rate by 25 basis points to a range of 3.75% to 4.0%, its first rate hike in three years. The market is currently pricing in an additional 25-basis-point rate hike before year-end, followed by two more in 2027—presenting further near-term headwinds for US consumers.
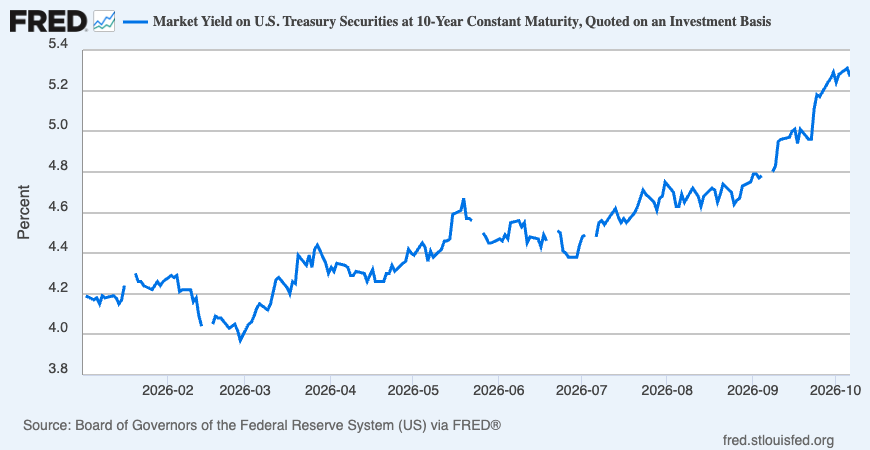
Source: St. Louis Fed
LOOKING FORWARD
We made two adjustments to AlphaGlider strategies early in the most recently completed quarter. The first was to decrease our significant overweight exposure to the S. Korean and Taiwanese equity markets. The second was to increase our exposure to the recently underperforming Chinese equity market. We did both adjustments in such a way that was neutral to our overall overweighting to equities in both developed and emerging markets.
We built an overweight position in the S. Korean equity market back in 2022 as a byproduct of our desire to gain more exposure to the Japanese equity market. At the time, the available Japanese country funds on offer had either high costs or suffered from poor liquidity—so instead we invested in Vanguard’s developed markets Asia Pacific exchange-traded fund (ETF),2 Vanguard FTSE Pacific ETF (VPL), which had a large exposure to Japan, and was both low cost (7 basis points) and reasonably liquid (~$50 million/day in average trading). We knew doing so would also trigger overweight exposure to other developed Asia Pacific markets like S. Korea and Australia, but given their individual small overall size we thought it acceptable.
And last year we decided to underweight the Chinese equity market while maintaining our overall emerging markets exposure. We did this by replacing part of our holding in our general emerging markets ETF with an emerging markets ex-China ETF, iShares MSCI Emerging Markets ex-China (EMXC). This swap had the net effect of increasing exposure to all other emerging markets as defined by MSCI, notably S. Korea and Taiwan.
Both of the portfolio changes paid off well for our strategies. While the extra exposure to Japan was neutral to our returns, reducing our Chinese exposure last year proved timely. But we hadn’t anticipated the biggest benefits of our 2022 and 2025 trades. The rapid buildout of AI infrastructure recently generated a massive surge in demand for AI chips and dynamic random-access memory (DRAM), causing prices for these products to soar. As most of the most advanced AI chips are contract manufactured by TSMC (Taiwan), and much of the world's DRAM is manufactured by Hynix and Samsung Electronics (both of S. Korea), the Taiwanese and S Korean stock markets were global market darlings over the previous 15 months. The Taiwanese market, as measured by iShares MSCI Taiwan (EWT), had increased ~150% over this period, while the S Korean market, as measured by iShares MSCI S. Korea (EWY), shot up ~300%. By early July, we believed the market had gotten ahead of itself, pricing in elevated memory and chip margins for far longer than fundamental supply-demand dynamics justified..
Before last quarter’s adjustments, our strategies were overweight the S Korean market by approximately 130% and the Taiwanese market by approximately 20%. In early July we took those overweight positions down to around 45% and 15%, respectively, by selling completely out of our VPL and EMXC positions. With the sale proceeds we bought a Japanese-only equity fund, JPMorgan BetaBuilders Japan (BBJP), to maintain our desired overweight position in Japan (approximately 70%), and the balance into our developed markets and emerging markets equity funds. This took our slight underweight position in Chinese equities, which had been a significant underperformer over the last 14 months (~flat vs global stocks increasing 30%, as measured by MSCI ACWI), up to a ~35% overweight position. Overall, these changes lowered our strategies’ fund management fees by between 1-10%, with reductions increasing with strategy risk (e.g AG-A reducing by ~10%, AG-C by ~1%).
Although some of you may consider this next topic to be a bit of “inside baseball,” I think it’s important to show how AlphaGlider looks out for its clients’ financial interests. Minimizing costs is a fundamental principle of our service as it translates 1:1 to our clients’ investment returns—but it’s hardly a set and forget process. The investment landscape in the US is constantly evolving, with new firms, new products, new technologies, and corporate activity creating new opportunities to lower costs and improve services to the end customer, but sometimes to raise costs and worsen service. The current moment feels especially dynamic in this regard.
Cost effective access to Vanguard ETFs has been central to minimizing the costs of AlphaGlider strategies from day 1. Out of the gate in 2013, we partnered with TD Ameritrade for our custody services—the only independent registered investment advisory (RIA) custody platform to offer commission-free trades on most Vanguard ETFs. This commission-free arrangement dated back to 2003 when Vanguard exited the RIA custody business and handed its RIA clients to TD Waterhouse (which later merged with Ameritrade in 2006 to form TD Ameritrade). But by 2017, ETFs were quickly on their way to overtaking mutual funds as the preferred investment vehicle for retail and advisory clients, and Vanguard was rapidly gaining market share in the ETF marketplace from the two early movers, Blackrock (iShares) and State Street (SPDRs). Perhaps with too much “profitless” Vanguard ETF business, TD Ameritrade began charging its clients $6.95 on each Vanguard ETF trade in 2017—causing AlphaGlider to substitute somewhat inferior ETFs (usually lower liquidity) that still traded commission-free (mostly from State Street which had agreed to pay a platform fee to get commission-free trading of its ETFs, something Vanguard refused to do) where it made sense.
Two years later, Schwab rocked the industry by eliminating stock and ETF trading fees altogether in response to a small but rapidly growing new entrant, Robinhood, which had been offering commission-free trades to retail investors since 2015. Schwab’s move forced its primary custodian competitors, Fidelity and TD Ameritrade, to quickly follow suit. But with less scale and no mutual fund or ETF business of its own to fall back on, TD Ameritrade was at a severe disadvantage to Schwab and Fidelity in this new commission-free world. Only one month later TD Ameritrade raised the white flag and agreed to be acquired by Schwab, taking the three-player RIA custody field down to two.
It doesn’t take an MBA to figure out that this new duopoly increased Schwab’s and Fidelity’s negotiating power over their customers and suppliers, in this case its account owners (e.g. you and me), the RIAs that use their platforms (e.g. AlphaGlider), and the fund houses selling through their platforms (e.g. Vanguard). Sure enough, in 2024 we saw Fidelity, and this year Schwab, institute platform fees on ETF and mutual fund companies or else trigger a $100 per trade fee on customers buying their funds. Although all deals have been done behind closed doors, it’s widely assumed that even Vanguard has given in to paying platform fees to both Fidelity and Schwab. Although we as investors don’t directly pay these platform fees, know that whatever Vanguard pays to the custodians is not available to decrease the expense ratios of its mutual funds and ETFs. As the ultimate customer, we are the ones who pay these platform fees.
The most recent twist to this battle between Vanguard and the Fidelity/Schwab custody duopoly was Vanguard’s August announcement of the ~$4 billion acquisition of an RIA custodian start-up called Altruist. Although Vanguard says the acquisition is to extend “the ‘Vanguard effect’ to more advisors and their clients through AI-forward wealth technology and custody platform,” it seems clear to us that Vanguard is making this move to improve its negotiating leverage against Fidelity and Schwab. Twenty-three years after exiting the RIA custody business, Vanguard is back in the game and will provide RIAs with a legitimate and capable alternative to Fidelity and Schwab. This should allow Vanguard the ability to push back against future platform fee hikes by Fidelity and Schwab, and perhaps even help Vanguard negotiate them lower. Vanguard’s acquisition of Altruist makes us optimistic that Vanguard will be able to continue to lower their costs through greater scale, and in turn pass their savings to its owners—you and me. We don’t know if we will need to shift our accounts from Schwab to Altruist or some other custodian to continue to enjoy the benefits of Vanguard funds, but know that we are monitoring the situation closely and we will always do what is in the best interests of our clients.
NOTES & DISCLOSURES
1This material represents an assessment of the market and economic environment at a specific point in time and is not intended to be a forecast of future events, or a guarantee of future results. Forward-looking statements are subject to certain risks and uncertainties. Actual results, performance or achievements may differ materially from those expressed or implied. Information is based on data gathered from what we believe are reliable sources. It is not guaranteed as to accuracy, does not purport to be complete, and is not intended to be used as a primary basis for investment decisions. It should also not be construed as advice meeting the particular investment needs of any investor.
2Mutual funds, exchange-traded funds and exchange-traded notes are sold by prospectus. Please consider the investment objectives, risks, charges, and expenses carefully before investing. The prospectus, which contains this and other information about the investment company, can be obtained directly from the Fund Company or your financial professional. Be sure to read the prospectus carefully before deciding whether to invest.
3Alternative investments, including hedge funds, commodities and managed futures involve a high degree of risk, often engage in leveraging and other speculative investments practices that may increase risk of investment loss, can be highly illiquid, are not required to provide periodic pricing or valuation information to investors, may involve complex tax structures and delays in distributing important tax information, are subject to the same regulatory requirements as mutual funds, often charge higher fees which may offset any trading profits, and in many cases the underlying investments are not transparent and are known only to the investment manager. The performance of alternative investments including hedge funds and managed futures can be volatile. Often, hedge funds or managed futures account managers have total trading authority over their funds or accounts; the use of a single advisor applying generally similar trading programs could mean lack of diversification and, consequently, higher risk. There is often no secondary market for an investor’s interest in alternative investments, including hedge funds and managed futures and none is expected to develop. There may be restrictions on transferring interests in any alternative investment. Alternative investment products including hedge funds and managed futures often execute a substantial portion of their trades on non-US exchanges. Investing in foreign markets may entail risks that differ from those associated with investments in the US markets. Additionally, alternative investments including hedge funds and managed futures often entail commodity trading which can involve substantial risk of loss.
4Rebalancing can entail transaction costs and tax consequences that should be considered when determining a rebalancing strategy.
5AlphaGlider LLC does not offer legal or tax advice. Please consult the appropriate professional regarding your individual circumstance.
^Indices are unmanaged and investors cannot invest directly in an index. The performance of indices do not account for any fees, commissions or other expenses that would be incurred.
aThe Standard & Poor's 500 (S&P 500) Index is a free float-adjusted market capitalization weighted index that is designed to measure large cap US equities. The index includes 500 leading companies and captures approximately 80% coverage of available market capitalization in the US equity markets.
bMSCI Europe, Australasia and Far East (EAFE) Index is a free float-adjusted market capitalization weighted index that is designed to measure the investable universe of developed market equities outside of the US.
cMSCI Emerging Markets (EM) Index is a free float-adjusted market capitalization weighted index that is designed to measure large and mid-cap equity market performance in the global Emerging Markets.
dMSCI All-Country World (ACWI) Investable Market Index (IMI) is a free float-adjusted market capitalization weighted index that is designed to measure the investable universe of global equity markets.
eThe Bloomberg Barclays US Aggregate Bond Index is a market capitalization weighted index that is designed to track most investment grade bonds traded in the United States. The index includes Treasury securities, government agency bonds, mortgage-backed bonds, corporate bonds and a small amount of foreign bonds traded in the United States. Municipal bonds and Treasury Inflation-Protected Securities (TIPS) are excluded due to tax treatment issues.
Copyright © 2026 AlphaGlider LLC. All Rights Reserved.
No part of this report may be reproduced in any manner without the express written permission of AlphaGlider LLC.