
INVESTMENT ENVIRONMENT 1
Source: Orion Advisor Services, AlphaGlider
Stocks and bonds started off the third quarter strongly when it appeared that inflation would soon subside, giving investors optimism that the world’s central banks would be able to moderate the pace of their rate increases. However, this bubble of optimism started to deflate midway through the quarter as inflation numbers came in higher than expected, forcing central bankers to speak more pressingly about their determination to reign in rising prices despite the pain it would inflict on households’ investment portfolios and job security. As a result, interest rates continued to rise, hitting both bonds and stocks just as in the first half of the year.
During the quarter, global equity markets declined 6.6% as measured by our equity benchmark, MSCI ACWI IMI.^d The US market (S&P 500)a fared slightly better with a 5.0% decline, but emerging markets (MSCI EM)c performed much worse, down 11.6%. The US fixed income market, as measured by our fixed income benchmark, Bloomberg US Aggregate,e fell 4.8%.
The story was similar for the last 12 months — stocks and bonds sold off hard, with declines overseas worse than in the US. Much of the relative weakness overseas was the direct result of a strengthening US dollar, which appreciated 10% against the Chinese yuan, 15% against the euro, and a whopping 29% against the Japanese yen. Global equity markets were down 21.2% and the US fixed income market was down 14.6%.
Source: Axios, data from Bureau of Labor Statistics
Inflation has been the driver of moves in investment markets this year, so let’s focus there. Monthly measures of core inflation (i.e. excluding volatile food and energy prices) in the US surprised to the high side in both August and September, up 0.6% and 0.4% on a month on month basis, respectively. On an annual basis, core inflation was up 6.6% in September, its highest level since August 1982. What was going on in 1982? I was about to start 8th grade, but that’s not important. What is relevant was that Paul Volcker was three years into leading the Federal Reserve’s (Fed’s) decade-long effort to suppress inflation expectations with significantly higher fed funds rates. Inflation was on the fall, not the rise.
A better parallel for today’s rapid rise in interest rates may be the late 1960s when core inflation rose from 2% to around 7% while the federal government ramped spending on its Great Society programs and the Vietnam War. The Fed reacted with higher rates, but began dropping them quickly once the economy fell into recession. A few years later energy prices quadrupled and core inflation broke into double digits when Organization of Petroleum Exporting Countries (OPEC) cut oil exports to the US for its support of Israel in the Yom Kippur War. Once again the Fed raised rates to dent inflation, but reversed course when the economy went back into recession despite inflation still running over 6%. A second oil shock hit in 1979, caused by the fall of the US-allied Shah in Iran, resulting in a more than doubling in the price of oil. Once again, the core inflation rate pushed well into double digit territory.
Then Paul Volcker moved into the Fed Chair seat in August 1979 when President Carter selected the previous Fed Chair, William Miller, to become the new Treasury Secretary. After a frustrating decade of persistently high inflation (and a slight negative real return in the US stock market), Volcker pledged to stamp out inflation expectations by going big, and going longer, with higher fed fund rates. Volcker’s Fed immediately raised rates several percentage points above the core inflation rate, and held them there throughout his entire eight year tenure as chair (and three years thereafter). The result was the “Great Moderation,” a multi-decade period of steadily declining interest rates and muted, less volatile business cycles, and booming stock and bond markets. The chart below details core inflation and Fed funds rates from 1965 to present.
August 1982, when core inflation was last at today’s levels, was a great time to have started one’s investment career. But as I stated earlier, today appears to have more in common with the late 1960s — not a great time to have started one’s investment career. US equity valuations are running high (today’s cyclically adjusted price-to-earnings ratio is 27x, down from 37x at the beginning of the year; it was >20x in the late 1960s vs 7x in 1982). Government deficits are elevated by high domestic spending (infrastructure, college debt relief, climate change, Covid) and defense spending (recovering from Iraq & Afghanistan wars, aiding Ukraine & Europe against Russian aggression, keeping ahead of China’s military buildup). The West is experiencing another energy shock, this one triggered by the Western boycott of Russian energy and the recent OPEC+ cut in oil production. Inflation is on the rise and the Fed appears to be behind the curve, the opposite of what was happening in 1982. After five rate increases, the Fed funds rate (3-3.25%) is still more than 3.25 percentage points below core inflation, whereas Volcker ran the Fed funds rate about 3 percentage points above core inflation in 1982 and throughout the rest of the 1980s.
Jerome Powell, the current Fed chair, appears to be taking the Volcker-lite approach. He talks of the need to slow the economy to get on top of inflation, inflicting pain on US households and businesses in the short term. He claims that failing “to restore price stability would mean far greater pain.” That sounds very much like something Volcker would have said were he still alive. However, the median forecast for the peak in Fed fund rates for all members of the Federal Open Market Committee (FOMC, i.e. Fed board) currently stands at 4.5%-4.75%, arriving in early 2023 — still well below the current 6.6% rate of core inflation. With elevated inflation, large forecasted government deficits, energy being used as a weapon, the labor market still tight (3.5% unemployment rate and 1.7 job openings per unemployed worker in September), and consumer spending holding at high levels, we think that the Fed may need to raise rates higher and for longer than the market, and most FOMC members, currently believe to get back to a lasting 2% inflation rate. If Volcker were the Fed chair today, we would likely see the Fed stress the need to quickly raise Fed fund rates to 9% or more, and maintain them substantially (~3 percentage points) above inflation for the balance of the 2020s.
Pivoting to the war in Ukraine, it continues with no end in sight, however the narratives have changed. Instead of discussing how much land Russia will take over, political and military pundits are now debating about how much occupied land Ukraine will be able to claw back. Russia is now on the back foot, running low on munitions and men. As a result, Russia resorted to purchasing artillery shells from North Korea, and drones and missiles from Iran, announced a 300,000 men draft, and threatened the use of nuclear weapons to defend its territory, included the four regions of Ukraine Moscow illegally declared to now be Russian territory. The war continues to play havoc on the economies of Europe, most notably through significantly higher energy prices as boycotts and sabotaged gas pipelines dramatically reduce Russian energy supplies. For example, below is a chart showing that French electricity spot prices are now more than 10x higher than two years ago.

Source: Trading Economics
Europe’s much higher oil, natural gas, and electricity prices have flowed into their industries’ cost structures in a big way. Sticking with France, the following chart shows that producer prices in August are over 40% higher than two years ago. While European companies have benefitted from the weakness in their respective currencies relative to the US dollar, higher energy prices have more than eroded that advantage.

Source: Trading Economics
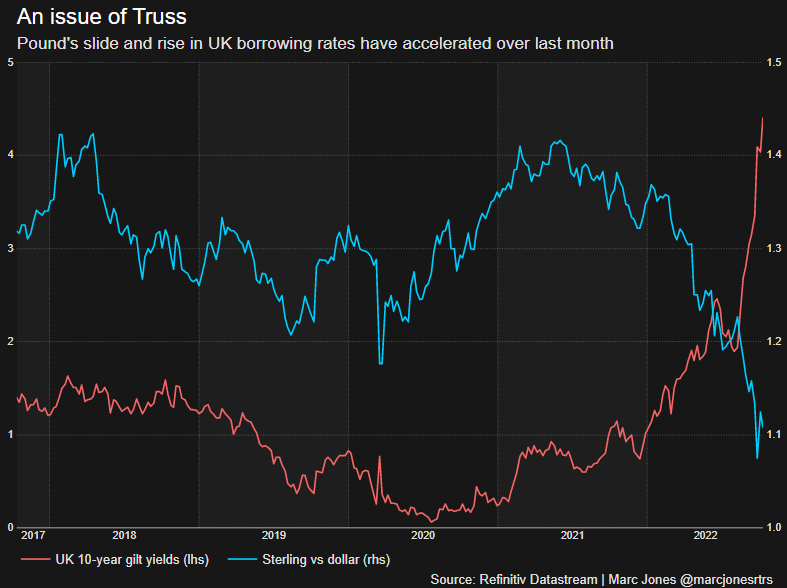
Staying in Europe, the UK saw its currency and debt markets thrown into chaos in late September by aggressive libertarian economic policies announced by it new Prime Minister, Liz Truss. Truss’s plan called for steep reductions in corporate taxes and high earners, and increased spending for an energy subsidy scheme, causing the financial markets to lose confidence in the fiscal competence of the British government. The British pound plunged to $1.05, its lowest level ever against the US dollar, and the yield on the 10-yr gilt temporarily spiked to 5% from just 3% entering September. The Bank of England, the UK’s central bank, had to put on hold its more restrictive policies combatting inflation in order to prop up the value of gilts by buying them in the open market. In an effort to save her job, she recently replaced Chancellor of the Exchequer (i.e. finance chief) Kwasi Kwarteng, retracted her plan to cut taxes for corporates and the rich, and reduced the amount of energy subsidies for British households and businesses. The pound and gilts have recovered some of their lost value on Truss’s reversal, but there are still many Conservative politicians calling for Truss to be replaced.
I’m sure there are several lessons that can be learned from this self-inflicted crisis, but two especially stand out to us. First, bond investors may have woken up to the massive increase in government debt caused by government-funded bailouts during the 2007/8 Global Financial Crisis and the Covid pandemic. The era of governments being able to take on substantial new debt without impacting their currency and interest rates may be coming to an end. For the UK, the ratio of debt to gross domestic product (GDP) went from 34% in 2006 to 96% this year. For the US this ratio is even higher, going from 61% in 2006 to 123% this year as shown on the following chart.
Source: Longtermtrends
That leads to the second lesson — even if bond investors give a pass to huge future government deficits, central banks may not have ability or willingness now to act as a buyer of the government debt issued to this fund deficit spending as they did during the 2007/8 Global Financial Crisis and the Covid pandemic. One reason that central banks may not buy more government debt at the moment is that it is inflationary, the exact opposite of what they are trying to achieve at the moment. Another reason is that the balance sheets of central banks are already stuffed to the gills with government debt and may not be able to handle more before investors begin to lose confidence in the country’s bonds, currencies, and economy. The balance sheets of the Bank of England and the Fed were both around 5% of their countries’ respective GDP in 2006, and now they are 40% and 35%, respectively. It should be noted that the Bank of Japan has pushed its balance sheet to over 125% of its GDP, but its economy has experienced miserable growth since 1990. The country’s stock market, as measured by the Nikkei 225,g is down an astonishing 33% from its 29 December 1989 peak. Emulating Japanese fiscal and monetary policy hardly seems like a plan for success.
The US is fortunate to have the world reserve currency, allowing the government to borrow heavily from overseas with little impact on the interest rates it pays and on the value of its currency. Even though the US government debt more than tripled between 2007 and today, foreigners have pinched their noses while continuing to accumulate dollar-denominated assets. But, reserve currency status is a fragile thing that can be lost with irresponsible fiscal management. The US has held the world reserve currency for about 100 years, about the same duration that the UK, and France before it. Going back further in time, the Netherlands held it for about 80 years, Spain 110 years, and Portugal 80 years. The Truss debacle is a reminder that government deficits matter and that central banks may not always be there to bail us out, especially in times of high inflation, large government debts, and bloated central bank balance sheets.
PERFORMANCE DISCUSSION
Third Quarter
AlphaGlider strategies underperformed their respective benchmarks during the third quarter, primarily due to overweight positions in poorly performing foreign equities. Emerging markets were hit especially hard by its largest country stock market, China. The country’s economy and its companies continue to suffer under its leaders’ zero Covid policy and high debt issues within its home building sector. A representative Chinese equity ETF,2 iShares MSCI China (MCHI), was off 23.7% during the quarter. Developed foreign market stocks continued to struggle with stubbornly high inflation and energy costs, particularly in Europe. Both developed and emerging markets were hurt by the strong US dollar which rose 7.1% during the quarter as measured by the US dollar Index (DXY).f Our strategies were also held by back by their exposure to physical gold which declined 8% during the quarter.
On the positive side of the ledger this past quarter, our strategies were once again helped on a relative basis by our large exposure to shorter duration bonds. Rates rose again this past quarter, hitting all bonds, but having shorter duration bonds dampened the damage to our strategies. Our single best performing security across all of our strategies was our market neutral fund, which as it name implies has an equal magnitude of long and short equity positions. Bucking the trend of poorly performing international equities, our Singaporean fund was down only 3.2% during the quarter. Our more aggressive ESG strategies were buoyed by their position in a clean energy fund which benefitted from the passage of the Inflation Reduction Act which includes $369 billion in new spending to combat climate change.
The following are individual funds that particularly helped, and hurt, our strategies’ performance during the quarter relative to our equity and bond index benchmarks (MSCI ACWI IMI -6.6% & Bloomberg US Aggregate Bond -4.8%):
Significant 3Q22 Detractors:
-14.4% iShares ESG Aware MSCI EM, ESGE
-13.8% Vanguard Global Ex-US Real Estate, VNQI
-12.3% Vanguard Europe, VGK
-11.2% Vanguard FTSE Emerging Markets, VWO
-11.2% Vanguard ESG International Stock, VSGX
-9.9% SPDR Portfolio Developed World ex-US, SPDR
-8.1% SPDR Gold MiniShares, GLDM
-7.5% Nuveen ESG Large-Cap Value, NULV
Significant 3Q22 Benefactors:
+1.6% Vanguard Market Neutral, VMNFX
+0.2% iShares Global Clean Energy, ICLN
-1.5% Vanguard Short-Term Treasury, VGSH
-2.0% Vanguard Short-Term Corporate Bond, VCSH
-2.1% iShares ESG 1-5 Yr Corporate Bond, SUSB
-2.7% Vanguard ST Inflation-Protected Securities, VTIP
-3.2% iShares MSCI Singapore Capped, EWS
Last 12 Months
All AlphaGlider strategies beat their respective benchmarks during the last 12 months, with the exception of the two most aggressive ESG strategies (AG-MA/esg & AG-A/esg) due to their large underweighting in fossil fuel stocks. As in the third quarter, the largest driver of relative outperformance for our strategies over the last year was the short average duration of their bond positions. Within equities, our strategies benefited from their skew towards value, quality, and defensive sectors like consumer staples. But unlike in the third quarter, our physical gold positions helped our strategies’ relative performance. The main source of drag on AlphaGlider strategies over this time period was their overexposure to foreign equity markets which significantly underperformed the US equity market.
The following are individual funds that particularly helped, and hurt, our strategies’ performance during the last 12 months (LTM) relative to our equity and bond index benchmarks (MSCI ACWI IMI -21.2% & Bloomberg US Aggregate Bond -14.6%):
Significant LTM Benefactors:
-2.4% Fidelity MSCI Consumer Staples, FSTA
-3.0% Vanguard ST Inflation-Protected Securities, VTIP
-5.3% Vanguard Short-Term Treasury, VGSH
-5.6% SPDR Gold MiniShares, GLDM
-7.1% Vanguard Value, VTV
-8.2% Vanguard Short-Term Corporate Bond, VCSH
-8.2% iShares ESG 1-5 Yr Corporate Bond, SUSB
-10.8% Vanguard Dividend Appreciation, VIG
-13.9% Nuveen ESG Large-Cap Value, NULV
Significant LTM Detractors:
-31.3% iShares ESG Aware MSCI EM, ESGE
-28.4% Vanguard Global Ex-US Real Estate, VNQI
-27.8% Vanguard FTSE Europe, VGK
-26.3% SPDR Portfolio Developed World ex-US, SPDR
-25.2% Vanguard FTSE Emerging Markets, VWO
-20.1% iShares MSCI Singapore Capped, EWS
OUTLOOK & STRATEGY POSITIONING
2022 has been a brutal year for most investment assets, short of the energy sector. As the table below shows, this year is shaping up to be the worst for diversified US-only investment portfolios in over 90 years, barring a strong Q4 rally. This is the kind of year we use to stress test investment portfolios to ensure that an investor is not taking on too much risk. The key is to not only survive a terrible, horrible, no good, very bad year like 2022, but to also maintain one’s nerve to stay the course so as to avoid selling at the bottom.
Source: AlphaGlider, data from Morningstar
Now for the good news about where we stand in October 2022. Valuations of both stocks and bonds are now much improved and have the potential for stronger returns going forward than they did a year ago. Below is a table showing various valuation metrics for the equity portion of the AlphaGlider’s Core Balanced Strategy (AG-B) as of the end of the third quarter, and as of a year prior. Valuations for equity portions of AlphaGlider’s other strategies are very similar to AG-B’s — 20-25% cheaper now.
Equities currently make up 56.5% of the AG-B strategy, with bonds making up another 35.0%. Bond valuations have also grown more attractive, perhaps more than more equities. When looking at the entirety of the AG-B strategy, its dividend yield (i.e. the strategy’s dividends divided by its total value) has nearly doubled, from 1.7% a year ago to 3.2% now. All AlphaGlider strategies, both Core and ESG, sport dividend yields between 3.1 and 3.4%.
Lower valuations translate into higher expected returns — something that played out well just over 90 years ago when balanced portfolios were hit even harder than this year. In the five years after the 60/40 US portfolio fell 27.3% in 1931, the portfolio more than doubled — annualizing 15.7%. Even when you look out 10 years, which captured the early years of World War II, the result was still a 5.7% annualized return. These numbers were pulled directly from the 60/40 portfolio chart on the previous page. Generally speaking, history shows that better things happen when you begin with lower valuations.
Although the US market, as measured by the S&P 500, is down about 16% over the last 12 months, we still find its valuations to be high on an absolute basis, and especially on a relative basis to international equities. The chart below shows the cyclically adjusted price-to-earnings (CAPE) ratio for US and foreign equities over time. The US premium remains at near record highs. As we’ve mentioned in the past, CAPE valuations are strongly correlated with future long-term (10-15 year) returns (higher the CAPE the lower the long-term return), but pretty useless in predicting returns over shorter time periods. The same is true with other valuation metrics that correlate strongly with long-term returns, such as cyclically adjusted price-to-book, price-to-cash flow, price-to-dividend (i.e. the inverse of the dividend yield) ratios. This being the case, we are keeping AlphaGlider strategies underweight US equities and overweight foreign equities.
We did make three adjustments to our strategies during the third quarter, all of which are partially in reaction to the rapid rise in the value of the US dollar over the last year.
The first adjustment was to skew our US equity allocations to small market capitalization (i.e. small cap) companies by selling our resilient US consumer staples fund and starting a position in a US small cap fund. Although the US equity market has been sold off across the board, small caps have been hit harder and are now trading at some of its lowest valuations in over 25 years. The chart below shows that small caps are trading about 30% below their long term average forward earnings multiple as well as about 30% below large caps. Although the likely recession in our near term future put forward earnings estimates at risk for all US companies, we believe that large cap earnings are at more risk given their larger reliance on exports which will be especially hurt by the higher value of the US dollar.
Source: Yardeni Research, AlphaGlider
The second adjustment we made was to swap out our Europe equity fund for a developed Pacific equity fund. Both funds declined spectacularly over the last 12 months (nearly 30%) and currently trade on similarly cheap valuations (11.5-12x forward earnings, not too dissimilar to US small caps). However, we’re more encouraged by the near term prospects for developed Pacific economies (e.g. Japan, Australia, S. Korea) as they don’t have a raging war going on next to them like Europe does, and that their more export-oriented economies will benefit more from US dollar strength. Japanese companies make up over half of the Pacific fund and their operating currency, the yen, declined a dramatic 29% against the US dollar over the last 12 months. South Korean companies, which make up about one-eighth of the fund, will benefit from the 20% decline in their operating currency, the won. Despite liquidating the Europe equity fund, we still maintain a small overweight position in European equities via our foreign developed markets fund.
The third adjustment we made was within our emerging market exposure. We swapped some of our overweight equity exposure for government bonds. Generally speaking, bond investors have been more pessimistic about the probability and/or severity of a global recession — i.e. bond valuations have fallen more than equity valuations relative to their long-term averages. This has definitely been the case in emerging markets. We are attracted to the healthy 7%+ yield to maturity of the emerging markets government bond fund, as well as the tailwind from a potential retracement of the US dollar’s spectacular run as of late.
The economic and political headlines may be pretty bleak at the moment, but we’re quite optimistic about the long-term returns of our strategies given the much more attractive valuations for bonds and foreign stocks.