
View a downloadable version of this blog entry »
INVESTMENT ENVIRONMENT1

Source: Orion Advisor Services
Financial markets were relatively quiet in April and May, but came alive in June. A weaker than expected United States (US) May jobs report released in early June alleviated fears of a summer interest rate increase by the Federal Reserve (Fed). This in turn helped boost fixed income securities prices. The most significant economic, and political, event during the quarter, however, came on June 23rd with the United Kingdom (UK) referendum on European Union (EU) membership—the so-called Brexit (British Exit) vote. Although polls before the vote showed the Remain and Leave camps in a dead heat, the perceived risks to the British economy from a Brexit were so severe that few in the financial and betting markets thought a majority of UK voters would actually vote to leave the EU. But that’s exactly what happened—Leave won over Remain, 52 to 48%.
Equity and commodities markets sold off aggressively in the two business days after the referendum, while prices for safe haven assets, such as sovereign debt and gold, were driven higher. But over the final days of the quarter, most risk assets rebounded, recouping most of the losses incurred in the two days after the Brexit referendum. Strangely, prices for safe haven assets did not retrace their moves, remaining in high demand even after the panic in the equities and commodities markets subsided. The yield on the 10-year Treasury fell from 1.75% before the vote to 1.47% exiting June. The market seems conflicted, perhaps schizophrenic, about the future impact of Brexit on the global economy.
One hard hit asset that did not rebound in late June was the British pound. It dropped 9% relative to the dollar in the two days post-Brexit, and remained thereabouts while other risk assets, including UK and European equities, rebounded.
We’ll touch upon what we think the investment implications of Brexit are in the Outlook & Strategy Positioning section later in this writing, but first we would like to succinctly explain how we think the world got into this position in the first place.
We think the core driver motivating the slim majority of Britons to vote for Leave is the stagnation of lower and middle class incomes over the last 30 years. Pro-Brexit politicians deftly manipulated the real and legitimate frustration of stagnant incomes by giving the disaffected classes someone and something to blame—immigrants and free trade agreements. They promised that leaving the EU would allow the UK to stop immigration and “unfair” economic competition, thus making their life better, like it used to be for their parents and grandparents. To anyone following the US presidential election, this might sound eerily familiar. Levels of income inequality, and lower and middle class income stagnation, are even higher in the US than in the UK.

Source: Piketty and Saez analysis of IRS data/The Wall Street Journal
The chart on the left shows how income has become more concentrated in the US over the last 35 years. The top 10% of earners went from around a 35% share of total US income in 1980 to over 50% in 2015. The top 1% of earners drove most of this growth, going from about a 10% share in 1980 to over 20% in 2015.
Losing share of income wouldn’t be so bad for the bottom 90% if their income was growing too, albeit at a slower pace. But this isn’t the case. The chart below shows the large divergence in cumulative real (inflation adjusted) income growth between the top 20% (blue line; dashed line is the top 5%) and the bottom 80% in the US over the last 30 years.

Source: US Census Bureau data/Doug Short
Globalization and technology have delivered remarkable gains in wealth for all nations participating in it, but that wealth has been shared unequally among its individual participants. The following chart published by economist Branko Milanovic, now known as the “elephant chart” in economic circles (see the elephant with its raised trunk?), shows how various income segments of the global population fared in real income growth over the 20 years between 1988 and 2008, a period of rapid globalization and advancements in technology.

Source: Branko Milanovic
This chart shows that those in emerging markets (they make up the bulk of the population below the 70th percentile in global income) did well, growing real incomes between 40% and 75% cumulatively over the 20 years. The richest 5th percentile (point C), i.e. the rich in developed markets, did well too, growing real incomes by over 60% cumulatively. It’s the lower and middle classes in developed markets (and the poorest of the poor in emerging markets) that did less well on a relative basis.
Simply put, globalization and technology have grown the pie of global wealth, but most of this growth has accrued to the new makers of old stuff (those in emerging markets), the new makers of new stuff (the well-educated in the developed world who innovate and adapt to new technologies, often among the richest in the developed world), and to the owners of the capital (the richest in the developed world). The old makers of old stuff (lower and middle classes in the developed world without higher education) have seen no growth in their piece of pie, and understandingly, they’re not happy about it. By voting for Brexit, the old makers of old stuff in the UK just knocked the pie onto the floor.
As an owner of capital, and allocator of capital for others, I am alarmed at the current political and economic situation of our world. There needs to be a more level distribution of the fruits of technology and globalization within the developed world, otherwise conditions may form that will allow nationalist, xenophobic, and economically harmful politicians to rise into power. We need to do more for our fellow citizens who bear the brunt of the negative aspects of free trade and technological advances—such as providing better early education and vocational training, and better social safety nets. Yes, it will be an expensive proposition for our society (and society, I mean the current winners of globalization), but I believe the alternative is even more costly.
Source: Nasdaq
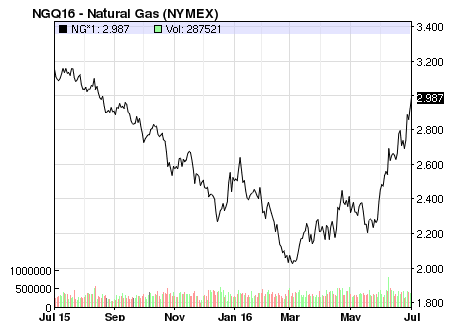
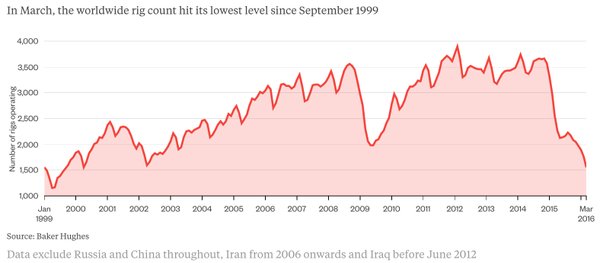
Tacking away from Brexit now, energy prices rebounded strongly in the second quarter. Crude oil prices finished above $50 per barrel while natural gas was approaching $3 per MMBtu at the end of June.
Energy prices were supported by production problems in Canada (forest fires) and Nigeria (sabotage), and by a reduction in production activity outside of OPEC nations. The following charts shows that the worldwide count of rigs in operation halved over the last 18 months ago, and is now at levels not experienced since 1999.
Source: Baker Hughes
Emerging markets were boosted this quarter by strong performances from Brazil and Russia. Brazil was helped by the progression of impeachment proceedings against its president, Dilma Rousseff, and both countries benefited from rising energy prices. But the economic crisis in oil-rich Venezuela continues to deepen. Basic foodstuffs there are increasingly absent, inflation exceeds 700% and its GDP is expected to fall by nearly 10% this year.
Source: @Callum_Thomas
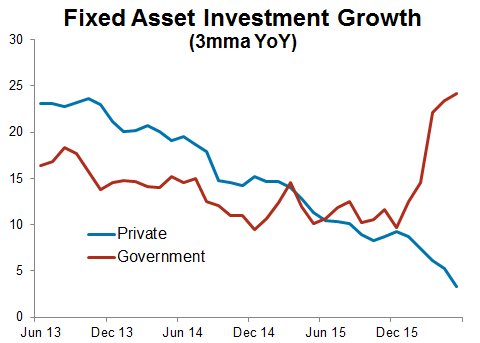
A “hard landing” in China was one of the market’s main worries last year, but the government’s aggressive acceleration in infrastructure spending has stabilized GDP growth within the government’s 6.5% to 7% target range. However if the past is any indication, much of this government infrastructure spending is value destructive. Growth in private capital expenditures, which are much more driven by underlying expected returns, continues to decline in the face of weak global demand and overcapacity in China’s manufacturing sector. The risk of a Chinese hard landing remains.
PERFORMANCE DISCUSSION
AlphaGlider strategies were flat to slightly down in absolute terms, but struggled relative to their benchmarks during the second quarter. Performance had been tracking well through the quarter, until the Brexit referendum. We were hurt by our overweight position in European equities (VGK2 & VEA) and our underweight position in fixed income (and underweight duration within our fixed income allocation) going into the vote, and our decision to lower the risk of our strategies ahead of the sharp rebound in the markets during the last week of the quarter.
Another detractor to all of our strategies was a poor quarter from VMNFX,3 our market neutral fund which had a strong 2015 and was profiled in my last quarterly commentary. It was down 4.5% during the quarter.
On the positive side, our strategies benefiting from the strong rebound in energy prices through FCG, a fund that invests in US companies exposed to natural gas. FCG was up just over 20% during the quarter.
OUTLOOK & STRATEGY POSITIONING
The UK voters’ decision to exit the EU was a major, unexpected event. It introduced, or revealed, significant downside risks to the global economy in the near term, as well as in the years to come as this unprecedented process to leave the EU plays out. We think that the world is a less stable place today than it was just a few weeks ago, with higher probabilities needing to be assigned to negative outcomes. This should have left a mark on the prices of risk assets, and it did for two days. But nary a week after the Brexit vote, risk asset prices were generally back to pre-vote levels. We think equity markets are being complacent in the face of high valuations and increased risks, leading us to reduce our exposure to equities in general, and to European equities in particular. AlphaGlider strategies are now underweight equities, and continue to be underweight fixed income, especially at longer durations.
Before we discuss the new risks introduced by Brexit, let’s start with where we stand with equity valuations.
US equity valuations are high and therefore pricing in a rosy future with little chance of significant downside risk. The S&P 500 is trading on a 26.5x cyclically adjusted price to earnings ratio (CAPE), a level exceeded in only three previous periods—ahead of the Great Depression (late 1920s), ahead of the bursting of the Dotcom Bubble (late 1990s) and the ahead of the Great Recession (mid 2000s).

Source: multpl.com
Valuations of international equities are more attractive, but they are also more directly exposed to problems that may fall out of Brexit. The CAPE for developed markets is 16.5x, while the CAPE for developed Europe is 14.7x. Emerging markets are even cheaper at 13.6x. Although AlphaGlider strategies are underweight equities as a whole, they are marginally overweight emerging market equities.
Now let’s move to the new or increased risks, as we see them post-Brexit. The most immediate one is that the UK tips into recession as uncertainty around the multi-year Brexit process causes business investment and consumer spending to stall. Continental Europe, where growth is currently anemic, could easily follow the UK into recession given their economic interdependence. Contagion of recession to other global regions could then follow as underlying demand from Europe falls, and as European competitiveness increases with the fall in the value of its currencies. Now seven years into the economic recovery and with central banks around the world running out of options to stimulate economic activity, Brexit has meaningfully raised the risk of a global recession in the near term.

Source: Financial Times
It’s only been a few weeks since the Brexit vote, but we have already seen some early stresses appear in the UK and continental Europe. In the UK, one measure of online jobs advertisements fell over 44% in the week following the vote outcome.
A surge in redemption requests forced the majority (by asset size) of UK property funds to either halt withdrawals or take major markdowns in their value. UK and continental European banks have also taken a hit post-Brexit. For the UK banks, it’s from the fear of losing access to business on the continent that has done the damage, as well as a Brexit-induced recession. For the continental European banks, where banks are more thinly capitalized, it’s mainly about rising bad loans that a recession may trigger. The Italian banks are considered to be the most at risk in this regard.

Source: Eurasia Group
Recessions are usually short-lived, but the unraveling of free and unencumbered trade between nations would cause significant and lasting damage to the world’s economy. Wealth grows with trade, so it’s only natural that wealth is destroyed when there is less trade. Brexit will hinder trade between the UK and the EU, and has made conditions more difficult for EU politicians to negotiate the proposed trade deal between the EU and the US (the Transatlantic Trade and Investment Partnership) over the coming years. The social impetus behind the Brexit vote result is present and growing elsewhere in Europe, and could threaten the very existence of the EU. Anti-EU and Eurosceptic parties are strong in many EU countries, most notably Austria, the Netherlands, France, Italy, and Sweden. The graphic on the right from the Eurasia Group, a global political risk research and consulting firm, shows the degree of risk each EU country has from direct political contagion falling out from Brexit.
One potential casualty that may arise out of the EU’s attempt to remain intact is the future state of the EU-UK trading relationship. EU politicians are incentivized to “punish” the UK for leaving, so as to deter other EU nations from following the UK’s lead out of the EU. Of course the EU will also punish itself if its trade with the UK is hindered. EU politicians are between a rock and a hard place when they begin negotiations with the UK over the terms of trade post-Brexit.
UK politicians find themselves between a different rock and and different hard place. The EU will only grant tariff-free access to EU markets if the UK continues to allow free movement of peoples. Brexit won in the UK on the promise that EU migrants, especially those from E. Europe, would be kept from entering the UK.
The nearest term threat to major free trade blocs is from the November US presidential election. Donald Trump, the presumptive Republican Party nominee for President, has pledged to renegotiate, or completely withdraw from, the North American Free Trade Agreement (NAFTA), the free trade deal between the US, Canada and Mexico that came into force over 20 years ago. He has also been highly critical of the recently negotiated Trans-Pacific Partnership (TPP) trade pact among 12 Asia-Pacific countries, and would presumably try to change it also. Additionally, Trump has threatened to impose 45% and 35% tariff on imports from China and Mexico, respectively, if they don’t play “fair.” We think that the fallout from Brexit would be small compared to a President Trump carrying through on any of his threats to the US’s primary trading partners. With the S&P 500 sitting on a CAPE of 26.5x, financial markets do not appear to be applying much probability of a Trump presidency, or at least one in which he carries through on his campaign promises.
The EU isn’t the only union threatened by Brexit—the UK as we know it is also at risk. Both Scotland and N. Ireland voted to remain in the EU, by majorities of 62 and 56%, respectively. Scots voted 55 to 45% to remain part of the UK in 2014, but that support may have shifted in the favor of independence with Brexit. N. Ireland, the only part of the UK to share a border with another EU nation, may very well decide that its links to Ireland and the EU are more important than those to what may be left of the UK—Wales and England, both disengaged from the EU. It should be noted that the EU may not welcome Scotland and N. Ireland as members. Both Spain and Belgium are fighting succession movements of their own, and thus may not want the precedent of a newly independent country gaining EU membership. A unanimous vote among member states is required to admit a new member into the EU.
Russian President Vladimir Putin has been increasingly hostile towards the West during his current term and we fear that Brexit will give him a more vulnerable and distracted target over the coming years. Russia’s annexation of Crimea in 2014, incursions into Ukraine, Georgia and Moldova, military buildup along its borders with North Atlantic Treaty Organization (NATO) allies in the Baltic, and more frequent harassment of NATO aircraft and ships are testing the resolve of the West. Russia’s aerial bombing of western-supported rebel areas in Syria accelerated the numbers of refugees fleeing to Europe, and in turn fueled European hysteria of immigration that played such a prominent role in the Brexit vote outcome.
Rather than rallying together to push back against Putin’s aggression, countries of the West have retrenched to a more fragmented and inward looking foreign policy footing. The US and the UK have historically been NATO’s strongest and most steadfast members, but with the UK exiting the EU and the rise of Trump in the US, both countries may shrink from their leadership roles going forward. We think the world is less stable and more dangerous when the US and the UK are less involved. From an investor’s point of view, we need the US and the UK to continue to lead.
These are some of the Brexit-related risks that we have identified. Some are independent of the others, but several are interconnected and could trigger a domino effect of damage throughout European and global economies. The Brexit process is complicated and without precedent, so we are also concerned about the risks we have not identified yet.
Financial markets appear perplexed about the implications of Brexit. Prices of traditional safe haven assets, like sovereign bonds and gold, spiked on the Brexit news, and have held their high levels in the following weeks. Meanwhile the prices of risk assets, such as equities, were initially hit, but quickly came back to their pre-Brexit levels. In some cases, prices have blown past pre-Brexit levels—the S&P 500 is currently challenging its all time high.
The S&P 500’s high valuation indicates that either the market disagrees with our estimate of the magnitude of downside risk scenarios, with the probabilities of said scenarios, or both. Seven years into this bull market with valuations at high levels, we are comfortable taking some money off the table. Our decision to de-risk AlphaGlider strategies in the days after the Brexit outcome cost us some relative performance as markets bounced. But we are comfortable with that. One only needs to look back to late 2007 when the S&P 500 was last trading at 26.5x CAPE to see that equity markets can miss early warning signs, even large ones (see chart on the following page). Investors ignored slowing growth, the collapse of major, long-lived financial institutions, falling bond yields, and most importantly, high valuations. Things were OK until they weren’t.
We are far from convinced that Brexit will trigger problems in the near or medium term, but we think that the probability of negative outcomes is much higher today than it was a month ago. We are invested accordingly.

Source: Federal Reserve Bank of St. Louis