
PHOTO: ED SCHIPUL
View a downloadable version of this blog entry »
INVESTMENT ENVIRONMENT
1
Source: Orion Advisory Services
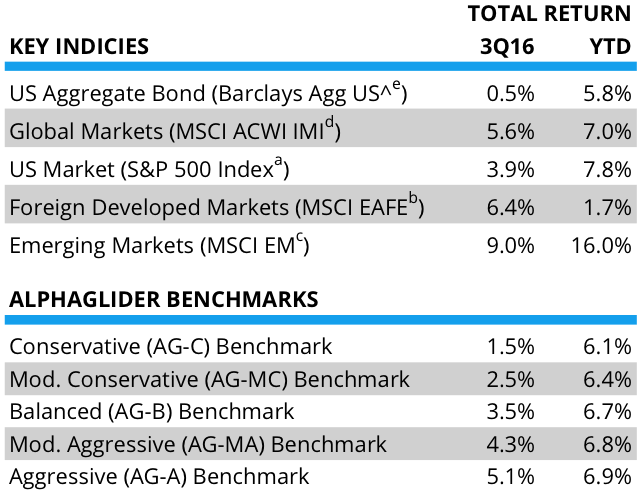
Risk markets were off to the races during the third quarter of 2016, confident that the globe’s major central banks would maintain their accommodative policies after the United Kingdom (UK) voted to exit the European Union (EU) and as the United States approached its November presidential election.
Equity markets performed strongly, with foreign markets besting the US market. Emerging markets were particularly strong, turning in a 9% gain during the quarter. Fixed income markets were more subdued, but the broad US fixed income market was still in positive territory.
The second quarter’s big event, Brexit (Britain exiting the EU), largely faded from daily headlines and investors’ minds, as UK politicians and bureaucrats began to prepare in private for the two-year period of exit negotiations with the EU. However, recent speeches by Prime Minister Theresa May and others on her political team indicate that they would rather give up duty-free access to the EU than continue to allow freedom of labor movement with the EU. This “hard” exit scenario is a very negative for UK and European economies, and in turn, investors in these markets, over the medium to long term. However, much may happen between now and early 2019 with the positions taken by UK and EU negotiators.
In the near term, the primary risk posed by Brexit is if UK and international businesses holding back on investment and hiring in the UK while they wait for more certainty in the future UK-EU trading relationship. Given buoyant share price performance in Europe, as well as the rest of the world, it would appear that investors are sanguine about the Brexit process. This seems at odds with the material downgrades in GDP growth forecasts in the Euro Area as shown on the following chart.

Source: @MxSba/Bloomberg
As expected, European central banks, including the Bank of England and the European Central Bank (ECB), were aggressive in their monetary stimulus, i.e. quantitative easing, programs over the summer. However, ECB policy makers were recently reported to be considering slowing down their €80 billion in bond purchases per month ahead of the program’s March 2017 end date. Until recently, the market had expected the ECB to maintain, or even increase, its bond purchases throughout 2017 and into 2018.

Source: Bloomberg
Adding to the stressful situation in Europe is the health of its banking system, most notably that of the largest bank in its largest economy — Germany’s Deutsche Bank. Its share price halved over the last 12 months on capitalization and liquidity worries, and a recent $14 billion US Department of Justice fine for its shady mortgage lending and securitization practices during the past housing bubble. Deutsche Bank’s internal problems, combined with its large and complex globally dealings, led the International Monetary Fund (IMF) to declare it to be the greatest systemic threat to the global financial system.
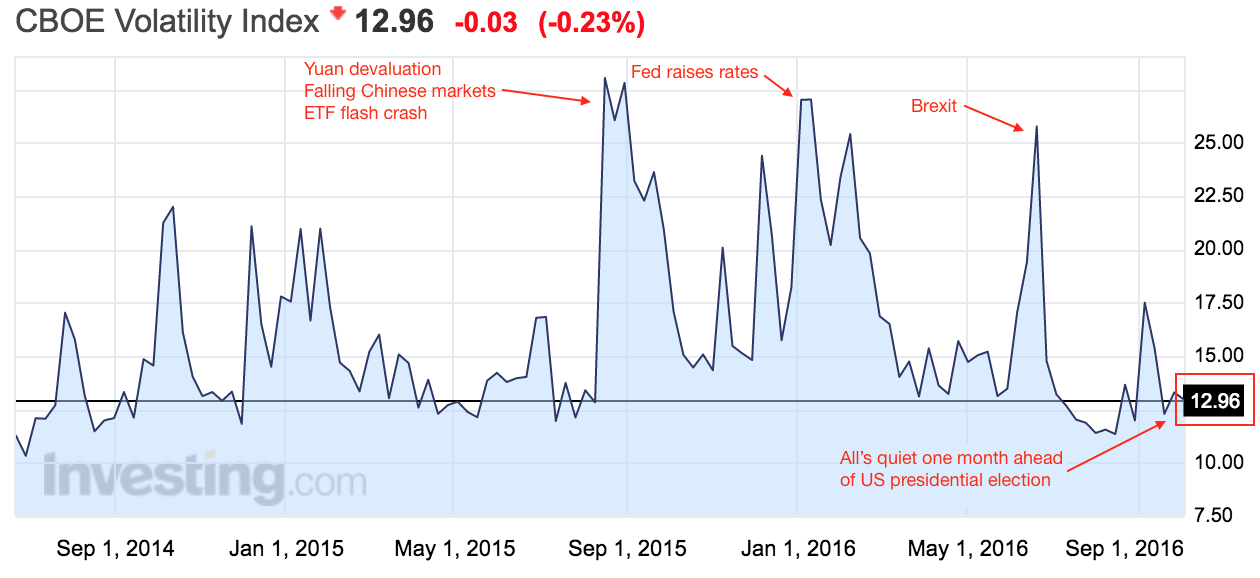
With less than a month before Americans elect their next president, the polls and betting markets indicate a 75-80% probability that Hillary Clinton will emerge victorious over Donald Trump. If the VIXf (formally known as the CBOE Volatility Index, a measure of expectations of S&P 500 volatility over the coming 30 days) is any indication, it would appear that investors are either overconfident of a Clinton victory, or they are overconfident that Trump will not carry through on his anti-free trade, anti-immigrant, anti-environment, and isolationist foreign policy rhetoric, if he were elected. The VIX was below 13 at the time of this writing, a figure well below its 5-year average of 16.5.
Source: Investing.com
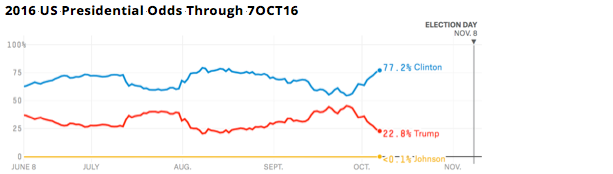
It all feels a bit like the month before the Brexit vote. Few investors, including ourselves, thought that the British population would possibly vote to leave the EU given the dire consequences of such an action — despite betting markets putting the chances of a Leave majority at a sizeable 20-25%. This is the same as Trump’s current odds of winning the US presidency. The charts below show how the Remain camp led the polls throughout the EU referendum campaign, just as Clinton has led throughout the US presidential campaign.

Source: The Spectator/oddschecker.co.uk
Source: FiveThirtyEight
Putting this in terms of an NFL field goal attempt, Trump wins if his kicker can make a 60-yard field goal. It’s a tough kick, but modern NFL kickers do make them — about once in every four to five attempts. This game is far from over, although you wouldn’t know it from all of the investors headed for the parking lot.

Source: FiveThirtyEight
Looking at the electoral map that was current as of this writing (see left), how could Trump make this “kick?” His best shot is to pick up Florida, North Carolina, Nevada and Colorado, states that he currently has 39%, 44%, 36%, and 21% chances of winning, respectively, per FiveThirtyEight on October 7th. Watch for the two candidates to be spending a lot of time in these states, and perhaps Ohio and Iowa where Trump clings to small leads, during the final weeks of the campaign.
Tacking away from politics, the longest streak of total job growth in American history continued in the third quarter.
With the economy nearing full employment and wage growth picking up (see below), the market is increasingly expecting the Federal Reserve (Fed) to resume raising rates in its first post-election meeting, in December — Fed Fund futures are currently pricing in a 60-70% probability of a December rate increase.

Source: St. Louis Fed/US Bureau of Labor Statistics

Source: Nasdaq
Two years ago Saudi Arabia crashed oil prices with a surge in new production in an effort to claw back market share from high cost shale oil producers in North America, and to squeeze the finances of its main rival, Iran. Now domestic pressure from budget cuts is pressuring Saudi to back off its strategy. In late September it agreed with other members of OPEC to cut production by approximately 700,000 barrels per day, with Saudi comprising one-half of this amount. Oil is now trading above $50 but we think it is unlikely to go significantly higher as it would encourage an increase in production from North American shale oil fields. In general, Saudi failed in its attempt to bankrupt the army of small shale exploration and production companies in the US and Canada. Rather, these companies became more efficient, lowering the oil price at which their operations meet their cost of capital.
PERFORMANCE DISCUSSION
The market was in full “risk-on” mode during the third quarter, so it was unsurprising that our strategies were not able to keep pace with their benchmarks. In general, our strategies captured 70-80% of the benchmarks’ upturn during the quarter. As I discussed over the last year, we are cautious about rising economic and geopolitical risks during a time of high valuations and stagnant profit growth. Our strategies are positioned defensively, to provide downside protection should markets turn down.
The most significant source of underperformance during the quarter came from our underweight position in equities. Global equities, as measured by the MSCI ACWI IMI, were up 5.6%. Another source was the relatively conservative positioning within our underweight equities position—conservative equities (i.e. low beta) underperformed more aggressive/risky equities (i.e. higher beta). As we said above, it was a “risk-on” market, which rewards riskier investments. For example, we were overweight US consumer staples (VDC), US healthcare (VHT), US high yield stocks (VYM), and US value stocks (VTV), all low beta segments that underperformed the average global stock.
Another detractor from performance was our larger than normal 5% cash position. With the two components of our benchmarks in positive territory (Barclays Capital US Aggregate Bond Index +0.46%, MSCI ACWI IMI +5.57%), any cash position in this low interest rate environment drags down performance. Additionally, our market-neutral fund (VMNFX3), had another difficult quarter, -0.7%.
Despite being underweight equities, all AlphaGlider strategies were slightly overweight the best performing regional markets — emerging markets. Our emerging markets fund (VWO) was up 12.7% during the quarter. Our more aggressive strategies also benefited from positions in US technology (VGT), which was up 7.3%.
OUTLOOK & STRATEGY POSITIONING
Well into the seventh year of a bull market fueled by aggressive central bank monetary stimulus, compelling long-term investments are difficult to find. Nowhere is this more true than in fixed income markets where yields have collapsed, and in many developed countries, gone negative. The days of low risk, mid single-digit real (after inflation) investment returns are in our rear view mirror. In response, savers and investors have moved up the risk ladder in hope of maintaining the level of investment returns to which they grew accustomed. This is a particularly dangerous scenario for insurance companies and pension funds which have under-collected payments and contributions, assuming that they would achieve mid to high single-digit long-term returns.

Source: The Wall Street Journal/Callan Associates
To the right is data generated by Callan Associates, an advisor to large investment funds, that shows the additional risk needed to generate a 7.5% nominal return in 2015 versus a 7.5% nominal return in 1995. Back in 1995, Callan estimated that it was reasonable to expect a 7.5% return with a low volatility (6% standard deviation) bond-only portfolio (68% confidence of the actual outcome falling within +/- 6.0% of 7.5%, therefore 1.5% to 13.5%). Entering that year, the 10-Year Treasury yielded 7.8%, and exited it at 5.7%.
Fast forward to 2015, the 10-Year had collapsed to 1.9% entering, and 2.1% exiting the year (for reference, it was 1.61% exiting 3Q16). An investor shooting for a 7.5% nominal return had to greatly increase the risk level of his or her portfolio—to an expected standard deviation of 17.2%, nearly three times higher than that of the 1995 portfolio. The window of outcomes expected to occur 68% of the time became a massive -9.7% to +22.7%.
[One caveat, Callan’s numbers use nominal returns instead of real returns. Real returns are more relevant to investors as it determines the purchasing power of their returns. Corrected for differences in expected inflation (would reduce the 2015 portfolio’s nominal return to ~6.0%), Callan’s conclusion that more risk needs to be taken today to deliver the same expected real return as in 1995 remains, but the magnitude of additional risk would be less than they presented.]
The key implication from the Callan chart for insurance companies and pension funds (and investors saving for retirement) is that this new low rate environment requires them to do one of two things, or combination thereof:
- Maintain lower levels of risk/volatility, but accept lower returns—requiring higher contributions to meet future expected/promised distributions, or distributing less than expected/promised.
- Maintain expected returns by increasing levels of risk/volatility—increasing the probability of investment returns being insufficient to meet expected/promised distributions.
However disconcerting these conclusions are, I believe the actual situation for savers and investors to be even worse than what Callan presents. It would appear that Callan uses historical returns for the riskier assets used in the 2015 portfolio, not expected returns based on current valuations and expected cash flow growth forecasts. As interest rates and bond yields fell, investors switched into riskier assets (often selling their bonds to the price insensitive central banks who were buying to satisfy their quantitative easing programs), substantially driving up their valuations.
Expecting assets to perform as well going forward as they did in the past is plain unrealistic and foolhardy. We are now in a seven plus-year long equities bull market, and benefitted from a 35-year span of falling interest rates which pressured all asset prices up.
We have covered our concerns about equity valuations, particularly those in the US, in previous quarterly commentaries. Although US equities are elevated on most valuation metrics, they are especially unattractive on the metric we find to be most accurate in predicting returns over long time periods, cyclically adjusted price-to-earnings ratio (CAPE or Shiller PE). When we use expected return and volatility projections based on CAPE valuations (we use the CAPE-based projections made by Research Affiliates; see below) we estimate that Callan’s 2015 “risky” portfolio has an expected long-term (10-year) annualized real return of about 3be standard deviation of 16%. This expected real return is one-half that projected by Callan.

Source: Research Affiliates
What is an investor to do in this expensive and overloved environment? We think that being a contrarian works best, just as it does when markets are cheap and unloved. This is how we’re being contrarian in this market:
- Underweighting or avoiding overpriced assets where expected returns are not justified by their risks. We believe US equities, longer duration fixed income, and real estate fit this description at the moment.
- Remain exposed to areas where valuations are attractive, or at least neutral, relative to their risks. Right now this is emerging market equities, market neutral equities, and inflation-protected treasuries.
- Keep our powder dry in anticipation that overpriced assets will underperform and eventually become attractive once again. Our dry powder is composed of cash and short-term fixed income that should hold its value well should interest rates increase.
- Lower our short-term return expectations and stay on top of our personal spending to be able to withstand a prolonged period of weak returns. Resist the temptation to chase performance in the late stages of this long bull market.
There are many ways to add alpha, but much depends on what part of the economic cycle we’re in. We think that this cycle is long in the tooth, so positioning ourselves to decline less than the overall market is the best way to add alpha right now.