

Heads of delegations at the 2015 United Nations Climate Change Conference (COP21), which led to the signing of the Paris Agreement. PHOTO: PRESIDENCIA DE LA REPUBLICA MEXICANA
View a downloadable version of this blog entry »
INVESTMENT ENVIRONMENT1

Source: Orion Advisor Services
After a sharp contraction in the third quarter, developed equity markets rebounded strongly in the final quarter of 2015. U.S. equity markets led most regions in the fourth quarter, despite selling off more mildly in the previous quarter. Emerging market equities followed up its dreadful 18% third quarter decline with lackluster performance in the fourth quarter. Aggressive government stimulus and minor currency depreciation ameliorated concerns of a hard landing in the Chinese economy, driving the Shanghai Composite Indexf up 16% during the quarter. Fixed income sold off modestly.

Source: Bloomberg
For all of the volatility that we saw in the third and fourth quarters, investment returns were rather flattish for most major asset classes over the duration of 2015. Major exceptions to this were commodities and emerging market equities to the downside, and the US dollar to the upside. A strong US dollar is usually negative for commodities and emerging markets, a pattern that repeated itself in 2015.

Source: The Wall Street Journal
2015 marked the 7th consecutive calendar year in which the S&P 500 returned a positive total return. During 2015, large caps and growth performed strongly in 2015 (think FANG stocks – Facebook, Amazon, Netflix and Google), leaving most of the rest of the US market in negative territory. The US energy sector was the big laggard of 2015, down over 20%.
In a well-telegraphed move, the Federal Reserve (Fed) raised short-term rates for the first time in nearly a decade. Meanwhile, most other major foreign central banks continued, and in some cases, increased their loose monetary policies. The European Central Bank (ECB) loosened further during the quarter with another deposit rate cut and the addition of six months to its asset-buying program (to March 2017), but the moves were less than the market had anticipated, causing the euro to spike in value.
There are two long-term secular trends that we follow closely as we feel they will create massive investment risk, as well as opportunity, over the coming decades — aging global demographics and global warming. The fourth quarter saw a significant event that may impact the later trend, an agreement (the Paris agreement) among 195 countries to keep a global temperature rise this century less than 2 degrees Celsius (oC) above pre-industrial levels, and to drive efforts to limit the temperature increase even further to 1.5oC above pre-industrial levels. Global temperatures are currently nearing 1.0oC above pre-industrial levels and they were projected to surpass 3.0oC in this century without additional measures.

Source: Met Office, Climatic Research Unit-University of East Anglia
The Paris conference succeeded where the 2009 Copenhagen conference failed largely on China’s change of heart on the issue. With his country’s carbon dioxide (CO2) emissions exploding 150% since the turn of the century and his country’s peoples beginning to protest over poor environmental living conditions, Chinese President Xi Jinping dramatically changed course last year to pledge to join developed countries in combatting climate change.

Source: Washington Post, Oak Ridge National Laboratory
The Paris agreement calls for aggressive additional reductions in CO2 emissions by developed nations, and restraining CO2 emissions by developing nations despite continued growth in their populations and living standards. Developed countries agreed to make a significant transfer of funds to developing countries to help them achieve this goal—starting at $100 billion annually from 2020 (to put this into context, $100 billion is ~0.13% of the ~$77 trillion global economy as measured by gross domestic product). The list of winners and losers from climate change will be shuffled should this agreement be successfully implemented. AlphaGlider is following these developments closely in its search for long-term investment opportunities and risks.
Turmoil emanating from the Middle East, most specifically the civil war in Syria, dominated headlines on the geopolitical front during the quarter. Islamic State (ISIS), one of the warring factions in Syria, directly conducted or inspired the downing of a Russian passenger jet on the Sinai Peninsula and major attacks against civilians in Paris, Mali and San Bernardino. While tragic, terrorism is not a new phenomenon in our world, and it rarely has lasting economic impacts. But more concerning is the surge of Syrian refugees into Europe, which in combination with terrorism fears, may cause the European Union to scrap the economically beneficial, completely free movement of goods and peoples across national borders.
PERFORMANCE DISCUSSION

Source: Nasdaq
AlphaGlider strategies rebounded nicely in the fourth quarter, but lagged their benchmarks. Our strategies were held back by their underweight exposure to relatively strongly performing US equities and an intra-quarter increase in exposure to US natural gas and emerging markets (see the Outlook and Strategy Positioning section later in this piece). Our overweight position in equities relative to fixed income benefitted our relative performance.
AlphaGlider’s most aggressive strategy, AG-A (Aggressive), matched its benchmark over calendar year 2015, but all other AlphaGlider strategies slightly trailed their benchmarks. As with their quarterly underperformance, full year underperformance was mainly due to our relative overexposure to international equity markets and our underexposure to US equity markets.
Reflecting back on 2015, our investment approach reminds me of the backcountry ski trip in the San Juan Mountains of southwestern Colorado I took with my family and some friends at the close of 2015. The area had just received a few feet of new snow, so avalanche danger was high. Instead of cancelling our trip, we proceeded cautiously with a whole host of safety precautions. Steven, one of my friends on the trip, had been a professional backcountry guide in his younger days, and had kept up on his avalanche safety skills, including taking a several day avalanche refresher course only the week prior. Days before the trip, Steven trained us all on how to locate and retrieve a buried colleague with the avalanche beacons, probes and shovels that each of us would carry.

Still, Steven pushed the trip back by a couple of days due to unacceptable risks. When we did finally go into the backcountry, he first consulted with the Colorado Avalanche Information Center, and then dug several snow pits to analyze the stability of the snow pack. As a result of this research in combination with Steven’s experience, we stayed off slopes greater than 30 degrees, and we crossed risky sections one by one so as to minimize the number of skiers that could be caught in a slide, and to maximize the number of rescuers available to find and dig out the unfortunate.
Steven’s precautions kept us safe while still giving us an exhilarating adventure. But it came at the cost of losing two days of our planned four-day trip and keeping us from skiing the exciting steeps. Chances are we would not have set off an avalanche had we skied those steeps, but it is a tradeoff Steven would make again, each and every day. We didn’t run from the risks, but we didn’t unnecessarily gamble our lives just to get in some great turns in the fresh powder. We still had a great time and with our health intact, we have many more rewarding backcountry trips ahead of us.
Steven’s precautions have a lot in common with the investing precautions AlphaGlider took this year. Using disciplined and thorough research and analysis, we identified downside risks and attempted to minimize them—most notably by overweighting developed international markets where valuations, and thus expectations, were modest, and tailwinds, in the form of weak currencies, low energy prices and loose central bank policies, were substantial. We underweighted the US where valuations and expectations were much higher, and headwinds from the strong dollar and a tightening Fed, were building.
As it turned out, the US markets outperformed developed international markets in dollar-terms by about 2.2% in 2015. Sure, in hindsight it would have been nice to be fully invested in the US last year. But it would not have been the prudent place to be fully invested. Going back to my backcountry trip analogy, just because you didn’t trigger an avalanche, it doesn’t mean that where you ventured was safe or that your actions were responsible. Having caution may remove some fun in the short-term, but it will keep you alive and enjoying life for the long-term.
The risk of any investment has to match, or exceed, the reward for it to work over the long-term. In our analysis, the risk/reward tradeoff of the US market was unattractive, just like the risk/reward tradeoff of skiing the steeps during our recent backcountry trip. I’ll explain more about US and international equity valuations in the next section.

“Fortune favors the prepared mind.”
OUTLOOK & STRATEGY POSITIONING
To frame our current thinking on global equity markets and the positioning of our strategies, I want to quickly review the conclusions I made last month in my Long Investment Time Horizons blog entry. In it I showed that short-term investment returns are volatile, and even with the aid of sophisticated valuation metrics, are unpredictable. The following chart shows S&P 500 valuation as measured by cyclically adjusted price to earnings (CAPE or Shiller PE) against subsequent 1-year investment returns (red). Using other valuation metrics to predict short-term market movements are unfortunately equally futile.

Source: AlphaGlider, Yahoo Finance, Standard & Poor's, Robert Shiller, US Bureau of Labor Statistics

Source: AlphaGlider, Yahoo Finance, Standard & Poor's, Robert Shiller, US Bureau of Labor Statistics
A key take home point from these two previous charts is that disciplined US equity market investors with long time horizons have a distinct investment edge over other market participants, particularly over those with short time horizons. This is why AlphaGlider has chosen to be a long-term, active investor.
Similar long time horizon advantages are also seen in developed international equity markets. The chart below shows the strong connection between CAPE values and long-term returns in the US, German, Japanese and 12 other developed equity markets.

Source: StarCapital Research
Source: Research Affiliates
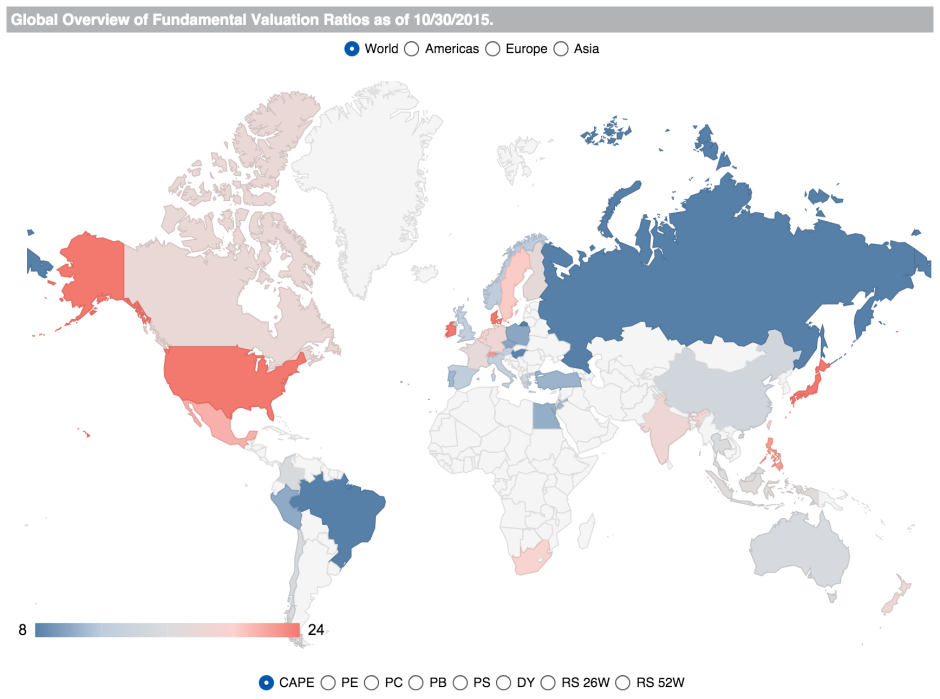
So what is the CAPE/Shiller PE telling us now about the current long-term investing environment? Below is a color-coded map showing country CAPE values, with deeper orange being on the more expensive side (lower expected returns going forward) and deeper blue being on the cheaper side (higher expected returns). These values are from October 30, 2015, but they’re close to today’s values. Among the major markets, Japan and the US stand out as expensive, commodities-reliant Brazil and Russia look cheap, while large swathes of Europe (UK, Spain, Italy), China and Australia look relatively attractive. Again, this is over the long-term, 10–15 years. What happens over the short-term is anyone’s guess.
Source: StarCapital Research
Today’s S&P 500 CAPE/Shiller PE is 25x, well above its long-term average of 16.7x. The S&P 500 Future 10-yr Return versus Shiller PE chart indicates that we should expect only 5% average annualized real returns from the S&P 500 over the coming 10 years. Looking at the StarCapital Research chart that uses CAPE data for 15 developed countries, we may be getting only 3% average annualized real returns from the S&P 500 over the coming 15 years. These return values should be viewed as “most likely” outcomes, the center point of a range of outcomes. As you can see on the StarCapital Research chart, 25x CAPE values have resulting in 15-year annualized real returns as high as 10% and as low as -2%.
Developed Europe’s CAPE/Shiller PE is approximately 15.5x now, well below the S&P 500’s 25x. The StarCapital Research chart indicates 6% average annualized real returns for developed Europe (with a range of +15% to -1%), twice that of the S&P 500. While only a 3% annual gap, this compounds massively over the 15-year projection period. We are looking at a 140% cumulative return from developed Europe over 15 years versus only 56% from the S&P 500 at these annualized rates.
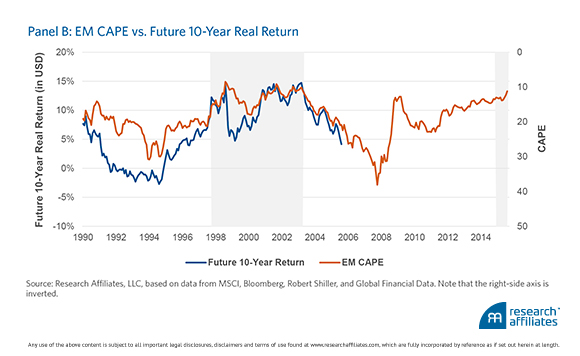
Emerging markets have an even lower CAPE/Shiller PE, anywhere between 11x and 14x depending on whose definition of emerging markets and valuation calculations you look at. Research Affiliates, the shop behind the EM CAPE vs Future 10-Year Real Return chart I presented earlier, puts the CAPE of emerging markets at 11x. And as you can see from their chart, 11x is just about the cheapest emerging markets have been at over the last 25 years. Emerging markets hit 11x back in the late ‘90s during the Asian and Russian financial crises, and again in the early ‘00s. As the chart shows, these were great times to invest in in the category, generating nearly 15% annualized real returns over the following 10 years – 300% cumulative returns.
Using the more conservative end of current CAPE estimates for emerging markets, 14x, we are still looking at low 2-digit average annualized real returns from the category over the next 10-years. While obviously more volatile than developed markets, it would appear that emerging markets are currently attractive to the long-term investor, especially relative to the S&P 500.
I have explained my preference for using CAPE/Shiller PE when making long-term investment decisions, but I always like to look at other meaningful valuation metrics, if anything else as a sanity check. The following table shows CAPE values in addition to the trailing 12-month price to earnings ratio (P/E), the price to dividend ratio (P/D), and the price to cash flow ratio (P/OCF) as of October 30, 2015, as provided by StarCapital Research. Again, Japan and the US stand out as expensive using any of the four valuation metrics, and emerging markets appear cheap. Developed Europe is a bit of an anomaly, having a relatively attractive CAPE, yet an unattractive trailing P/E. This is caused by the current depressed profit margins of the region’s companies. The US has the opposite issue—its current profit margins are at a cyclical high, thus making its trailing P/E look much more attractive than its CAPE. Reversion to the mean is a friend to European investors, and a foe to US investors.

Source: AlphaGlider, StarCapital Research
Developed European equities’ relative attractiveness over US equities on long-term valuation metrics is not new. It was what led us to go overweight developed Europe several years ago. Unfortunately, this positioning has caused us to underperform our benchmarks. As the first chart in this section demonstrated, short-term returns are volatile and unpredictable, regardless of investment method used. We remain confident in the history that solid fundamental analysis prevails over the long-term. We are long-term investors and we will not be shaken by bouts of short-term underperformance.
Besides a significant advantage with relative valuation, we like that developed Europe is benefitting from weaker currencies, accommodative central bank actions and low energy prices. Its companies are operating below capacity, thus any acceleration in growth should be beneficial to operating margins. US companies, on the other hand, are being challenged by the stronger dollar and a central bank that is raising rates. And although US consumers are benefitting from lower energy prices like those in Europe, the US has a larger energy sector relative to Europe. US companies are operating extremely efficiently right now, thus new growth will likely come at the expense of higher capital expenditures, the hiring of new employees and the expense of pay raises to attract and retain employees in today’s increasingly tight US labor market — putting pressure on profit margins.
We were underweight emerging markets entering the year, but the category’s poor performance during 2015 brought valuations down sufficiently by the end of the year that we took our emerging markets positions up to a more neutral level. Emerging markets are facing substantial headwinds with the severe price collapse in nearly all commodities, increased debt repayment burdens that come with a stronger US dollar (much emerging market debt is denominated in US dollars) and poor government policy (especially in Brazil, Russia and China), but we feel that valuations have sufficiently priced in these risks. To fund our higher emerging markets positions, we trimmed our winners – US consumer staples (VDC), information technology (VGT) and US large cap equities (IVV).
In the fourth quarter we also moved to trim duration in our fixed income exposure, in anticipation of the Fed raising rates. We eliminated our most interest-rate sensitive positions, specifically our long-term bond funds (BLV and VGLT) and real estate funds (VNQ and VNQI), while increasing our exposure to short-duration bond funds (BSV, VCSH and VTIP). The average duration of our fixed income positions now sits between 3.5 and 4 years — well below the 5.7 year duration of the fixed income component of our strategies’ benchmarks. Our overall fixed income positions increased in size, reflecting our concerns over US equity market valuations.
We did well to be underweight commodities most of this year. But with such a dramatic collapse in prices, we began looking for opportunities where we thought prices may have bottomed or overshot to the downside, and that offer large upside over the medium to long-term. We feel that U.S. natural gas fits this criteria. Prices are back to the lows briefly touched back in 2012, a level that is uneconomic for many gas producers. During the fourth quarter we chose to invest in a fund that invests in companies involved in the exploration and production of gas (FCG, First Trust ISE-Revere Natural Gas Index Fund) instead of a fund holding short-term natural gas futures. Gas futures, like most commodities futures currently, are in severe contango (future prices are higher than current spot prices) at the moment. As we are reasonably confident that natural gas prices will eventually return to a price above $3/MMBtu range, but less confident of the timing, we want to own a vehicle that will not severely punish us if gas prices remain flat throughout the winter and spring. We funded our natural gas exposure by exiting our unsuccessful investment in an agriculture related company fund (MOO).