
Photo Credit: Roger Brown
INVESTMENT ENVIRONMENT1
Source: Orion Advisor Services, AlphaGlider
The third quarter of 2023 was a rough one for most asset classes around the world. Global stocks fell by -3.4%, as measured by the MSCI ACWI IMI Index,^d with foreign developed markets doing slightly worse, emerging markets doing slightly better, and the US market inline with this global equity index. Fixed income also suffered similarly — our fixed income benchmark, the Bloomberg US Aggregate Bond Index,e declined by -3.2%. The best performing major asset class during the quarter was energy, helped by reduced supplies from Saudi Arabia and Russia, and modest growth in demand.
Returns for the last twelve months are a much rosier picture, with the exception of longer duration bonds that were nailed by rising interest rates. Global stocks booked a 20%+ gain, with foreign developed markets posting a nearly 26% gain while emerging markets lagged with a still satisfactory 11.7% return. The US equity market was again in line with the global equity index. Fixed income was able to squeak out a modest 0.6% return, but this masked the respectable performance from shorter duration bonds and dismal showing from longer duration bonds.
Source: Bloomberg
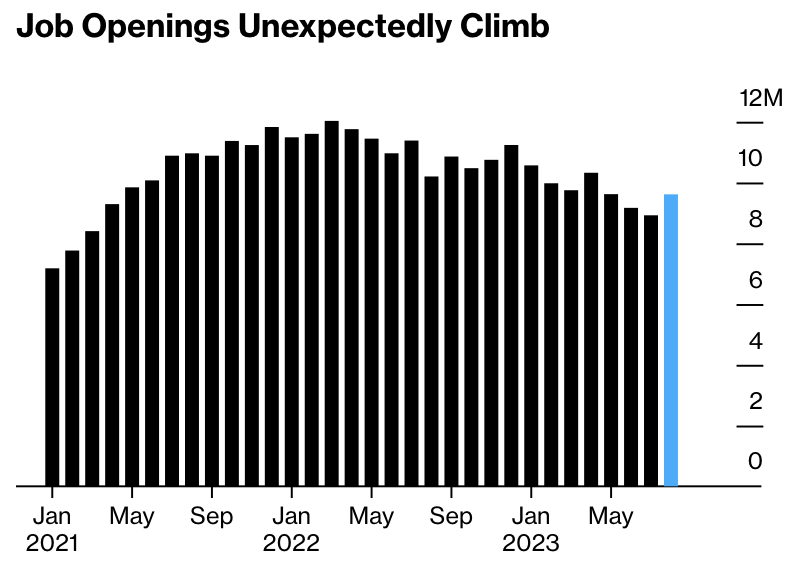
The US economy continues to defy the drag of high interest rates, posting resilient employment, consumer spending, and gross national product (GDP) figures. The unemployment rate stood at a tight 3.8% in September (it bottomed out at 3.4% in April), while the August Job Openings and Labor Turnover (JOLTS) survey showed a unexpectedly strong rebound in job openings as shown to the left.
August’s measure of real (i.e. excluding inflation) personal consumption expenditures (PCE) was a solid 2.3% and Q3 real GDP is forecast to come in around 3%.
Source: Axis Visuals, AlphaGlider
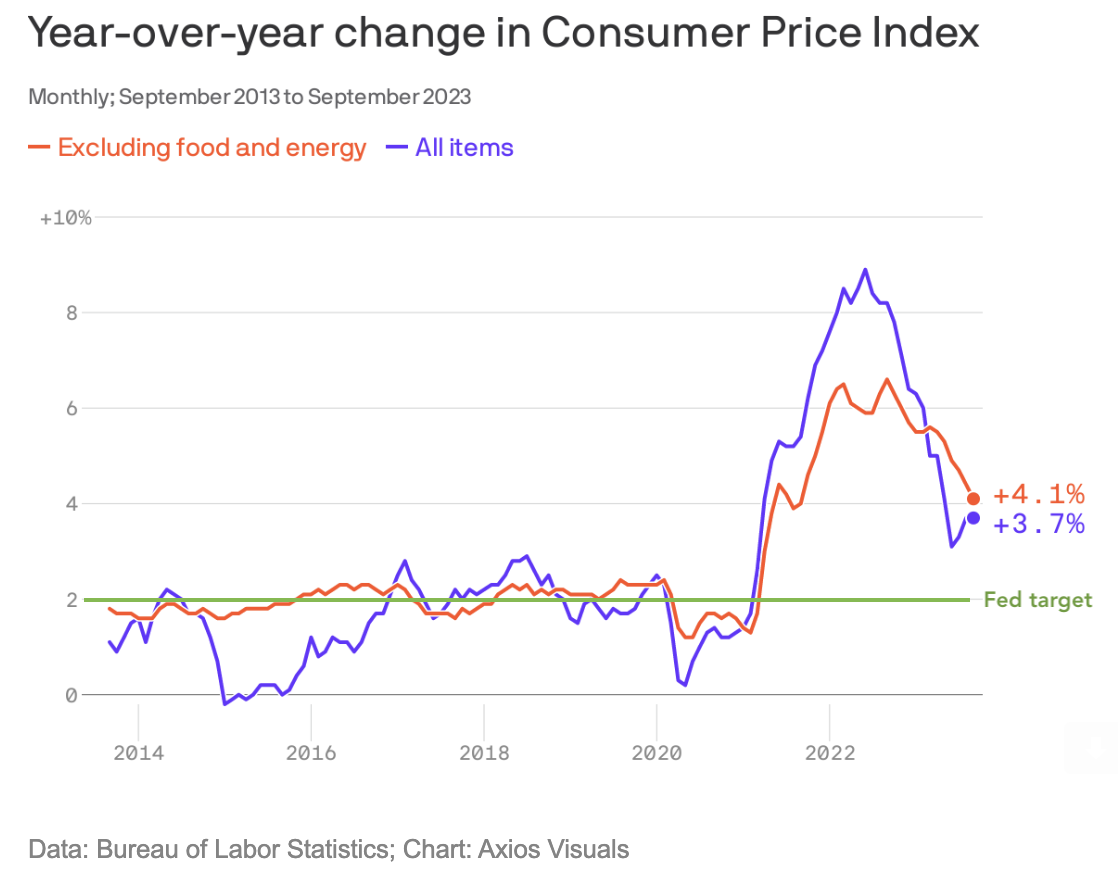
All of this positive news for the US economy, however, was bad news for the Federal Reserve (Fed), as it attempts to reign in inflation. Excluding volatile food and energy prices, the September consumer price index (CPI) was 4.1% higher than a year before, well above the Fed’s target of 2% as shown to the right. The Fed raised its Fed Funds Rate to a range of 5.25-5.5% at its July meeting. Although the Fed paused there at its September meeting, it continued to signal its “higher for longer” mantra for rates, including the likelihood of one additional rate increase before year’s end.
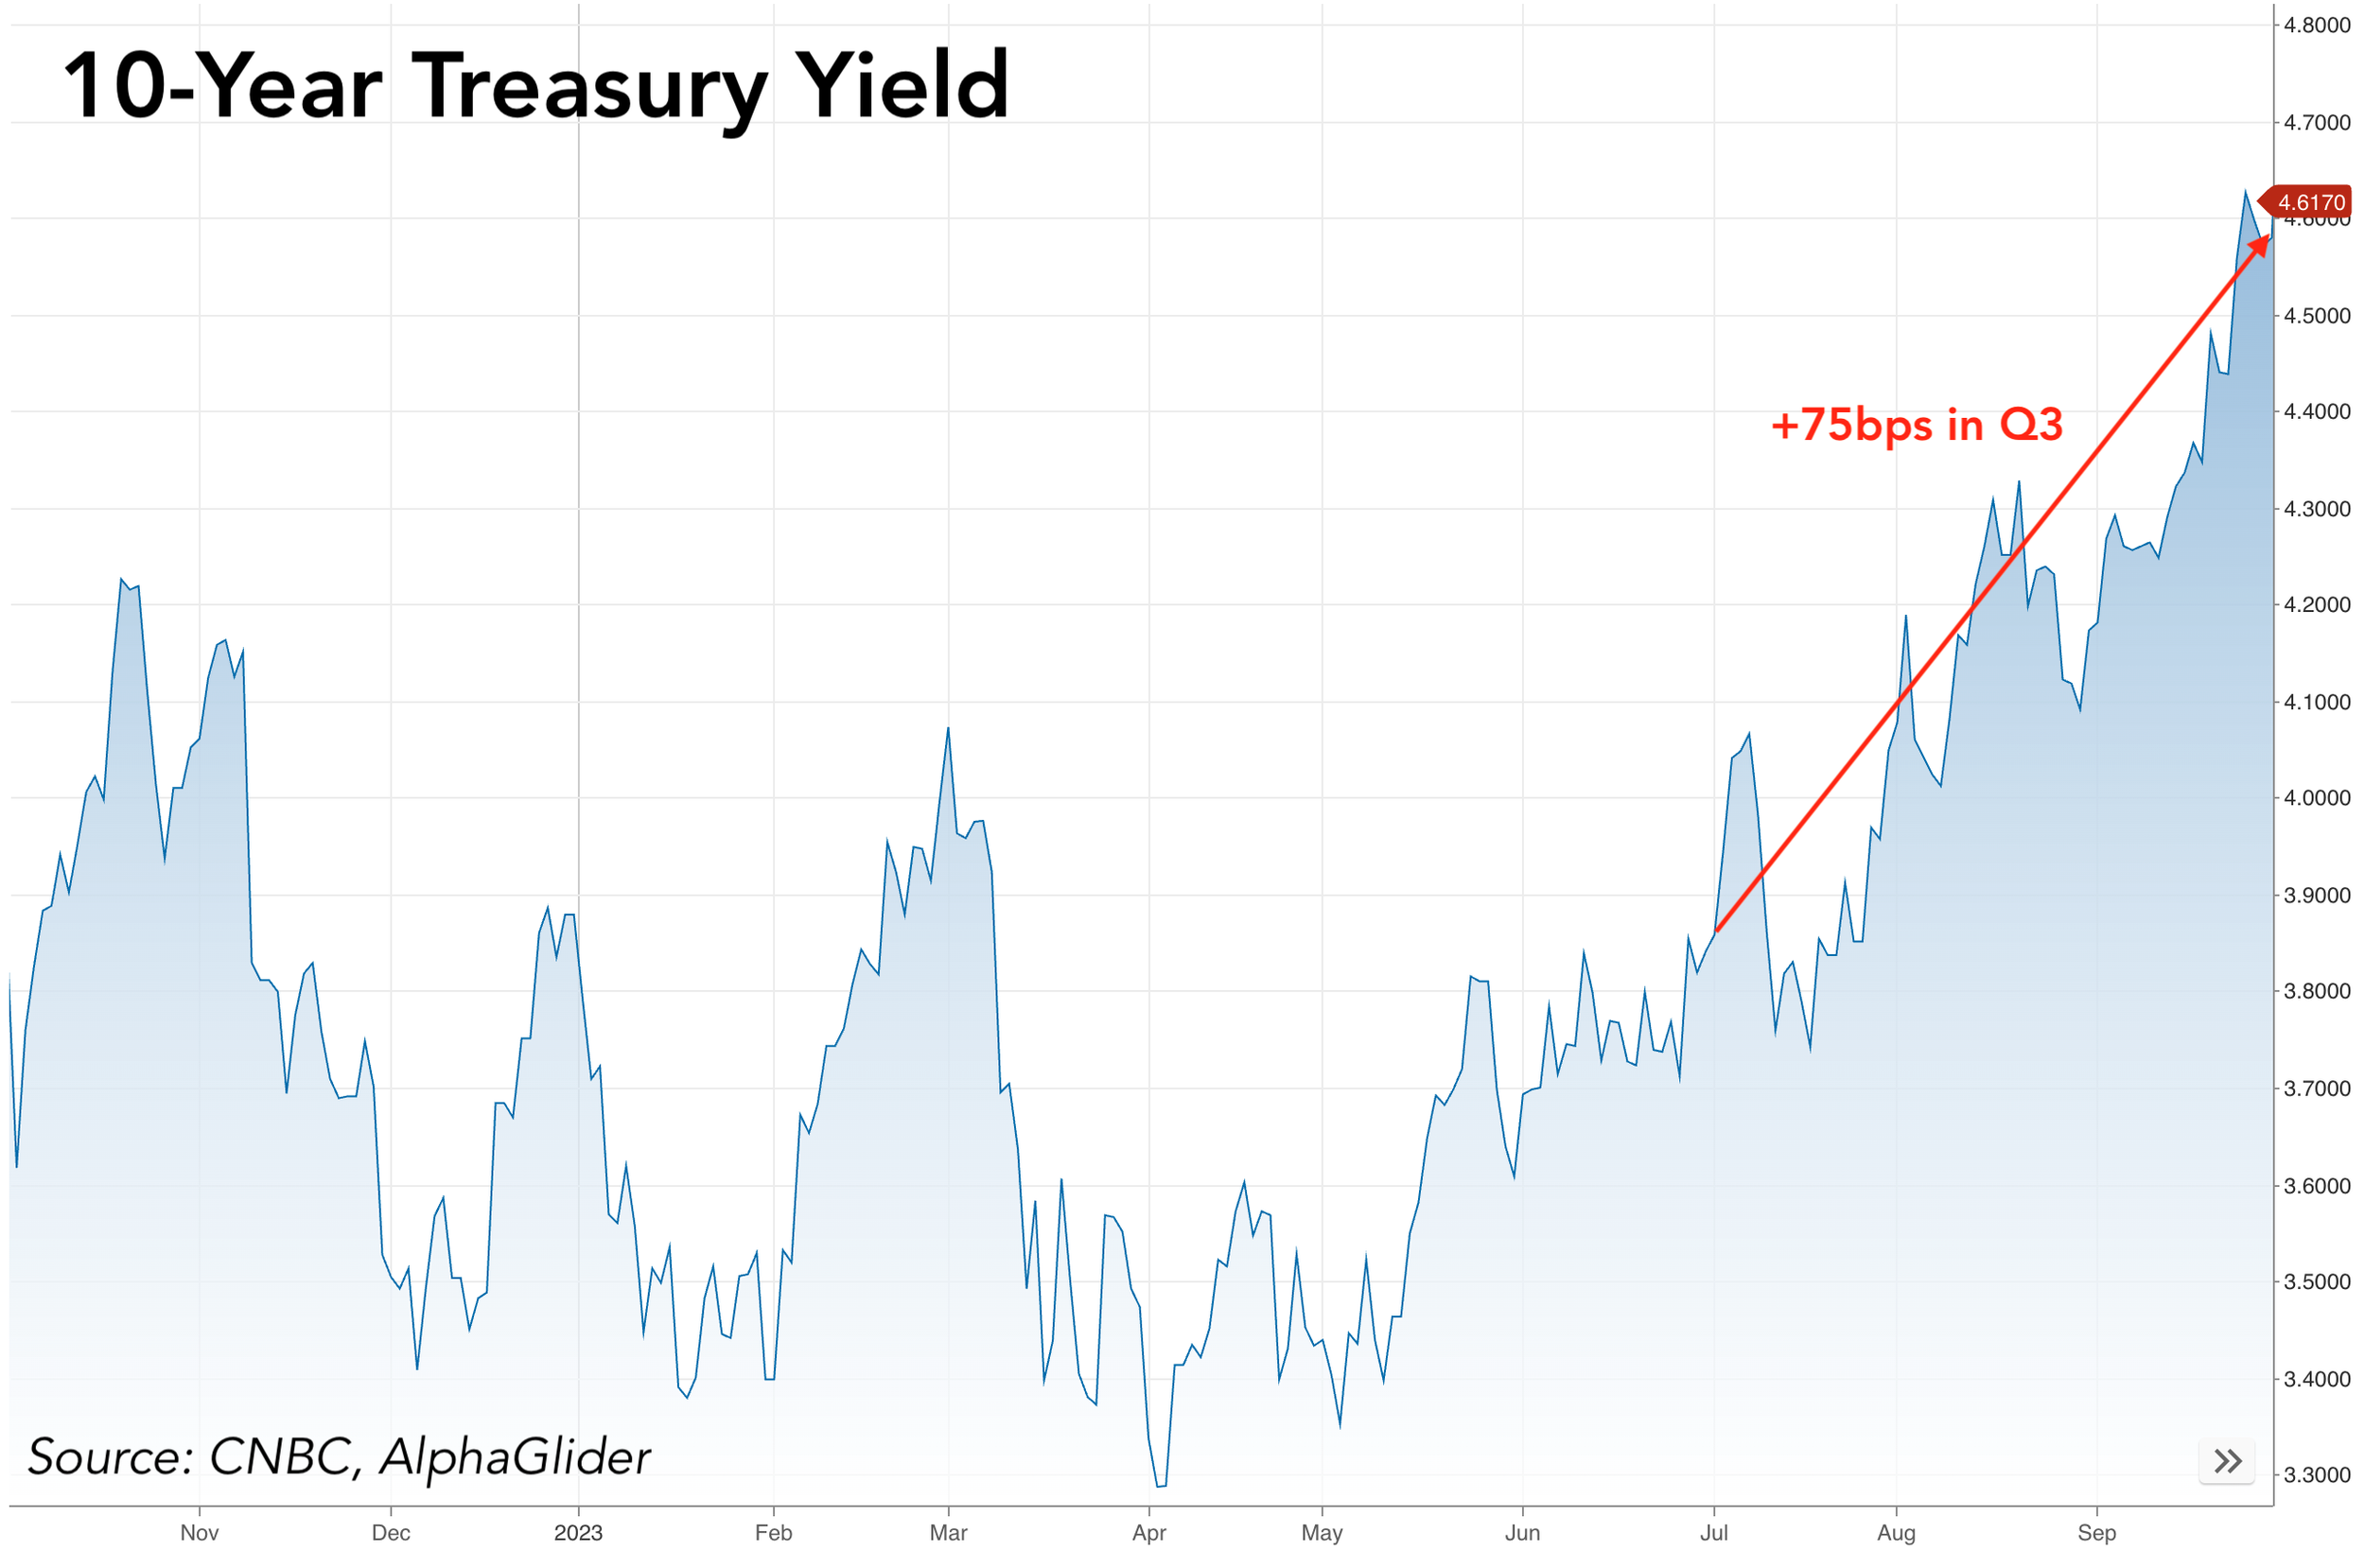
Fixed income markets finally appeared to have bought into the Fed’s “higher for longer” talk, pushing the 10-Year Treasury yield up 75 basis points to 4.58% during the quarter, reaching a level not seen since mid-2007 (see chart below). If there was any single event that caused stocks and bonds to fall this past quarter, it was this story of persistently high inflation.
Source: CNBC, AlphaGlider
Later this month the 10-Year/3-Month yield curve will have spent a full year in negative territory (i.e. the yield on the 10-Year Treasury being higher than that on the 3-Month Treasury). This is by far the longest stretch since Bloomberg records began in 1962. As I have mentioned multiple times in past CIO Commentaries, the 10-Year/3-Month inverted yield curve has been a reliable indicator of coming recessions, including all eight recessions that have occurred since 1970, without any false positives. Exiting September, the yield gap between the 10-Year and the 3-Month Treasuries was -1%, down from -1.9% in early June, but still larger than any period since the early 1980s.
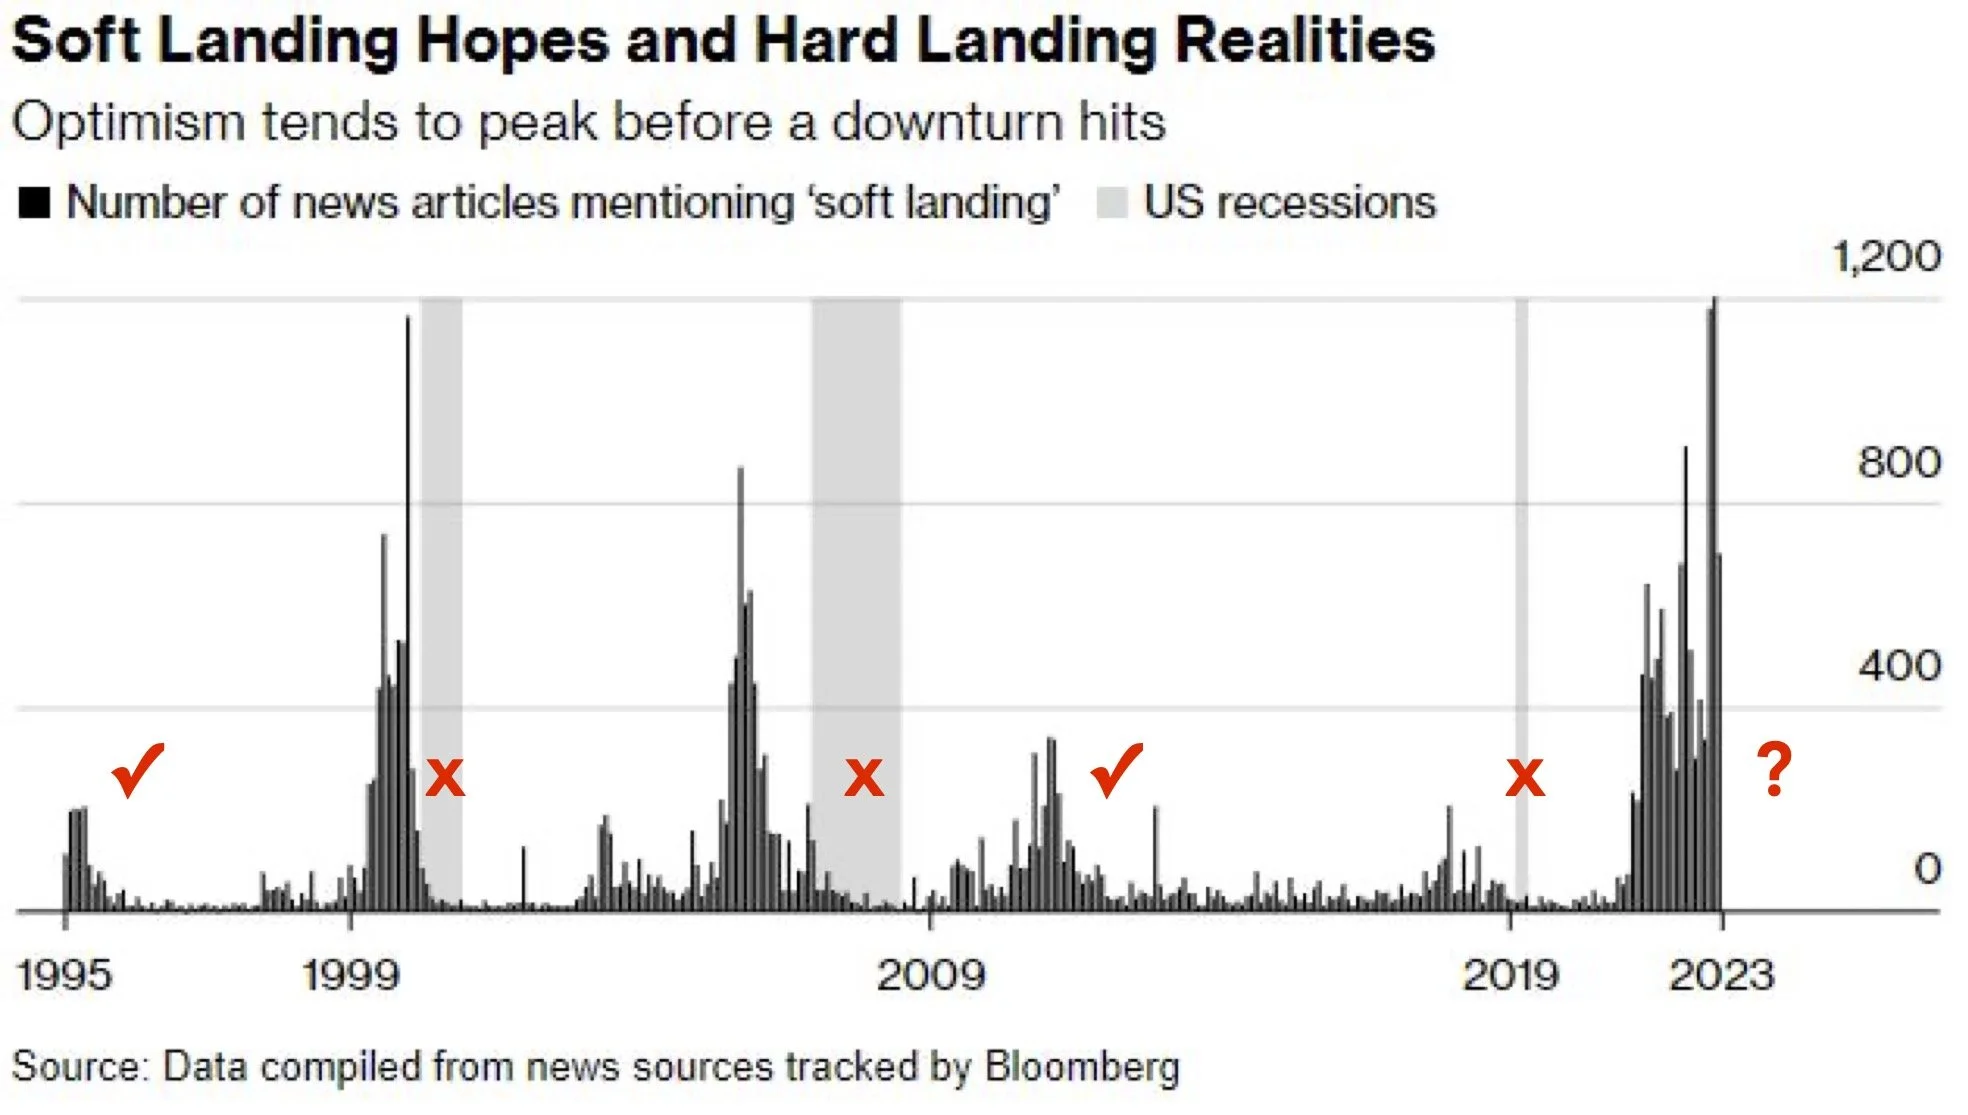
Despite this ominous signal, there has been substantial and growing optimism among companies, economists, and the press that this time will be different, and that the Fed will be able to pull off a “soft landing” for the US economy — i.e. reducing inflation without triggering high unemployment and recession. This is seen in the two charts below, the first showing the frequency of news articles mentioning “soft landing” and the second showing the frequency of companies mentioning it. They show a few things: 1) frequent talk of “soft landings” often end in recession (see red Xs), 2) the recent optimism that the US will experience a “soft landing” has been longer and stronger than in past periods that ended in recession, 3) sometimes the optimism is warranted, as in 1996 and 2011-13 (see red checks).

While we are encouraged by the strength of the US economy and hope that the country will avoid recession and all the pain it brings to everyday workers and investors, we have a realist view of the US investment opportunity. Below are a few concerns we have about US equities and what keep us underweight them:
1) High valuations
Despite last year’s -18.5% return from the S&P 500, US stocks remain highly valued relative to their history — as shown below in a historical chart of the S&P 500’s
Shiller PE
.

Source: multpl.com, AlphaGlider
Paying high valuations may be fine when one is expecting corporate revenues to accelerate and profit margins to expand. However severe pain ensues should those revenue and profit margin expectations do not materialize, as we all know from living through the formation, and then bursting, of the dot-com bubble (see previous chart again). Simply put, we think that the range of expectations for US corporate revenue and margin expectations implied by today’s valuations are on the optimistic side.
2) Sustainability of corporate margin expansion
Continuing on this discussion of high market expectations for US corporate margin expansion, we note that US operating margins have doubled over the last 30 years, as shown below.
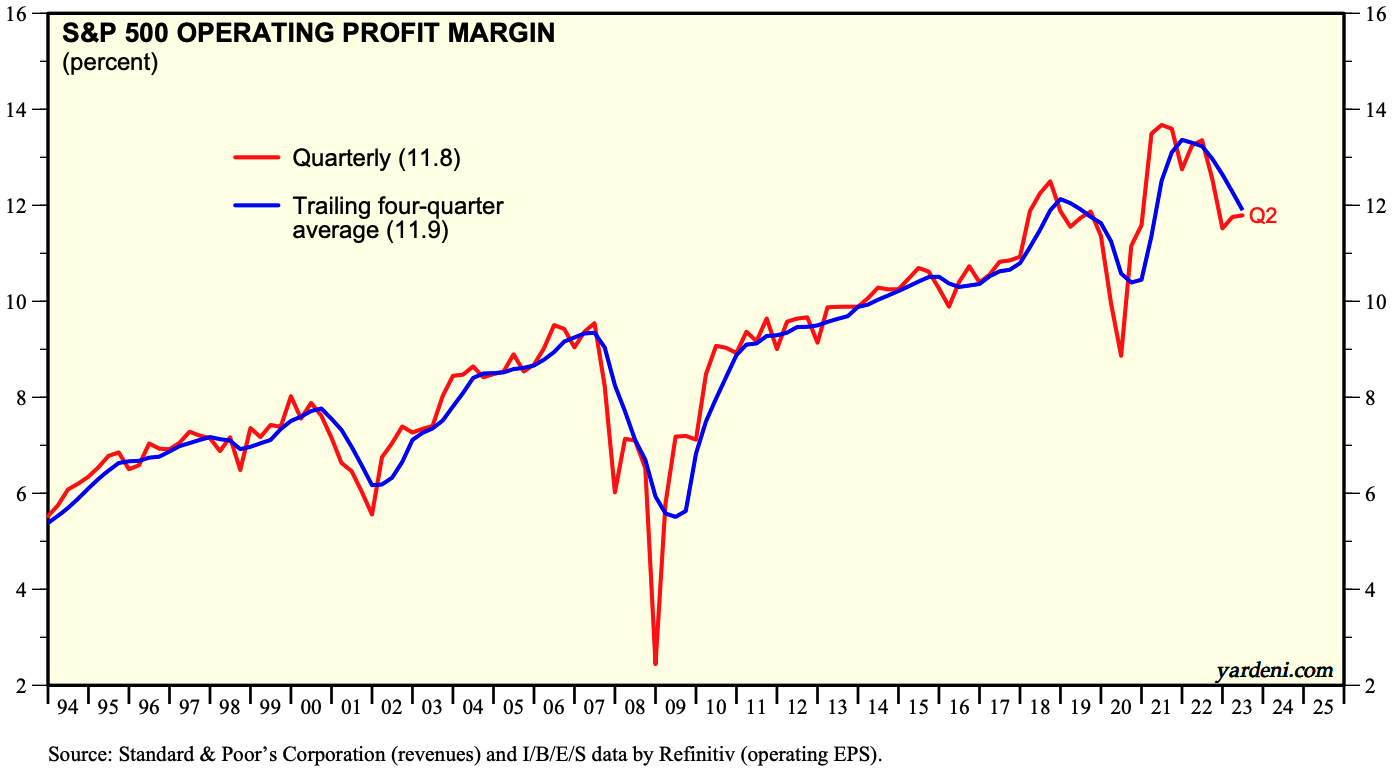
Source: Yardeni Research, Inc.
There are many reasons for this expansion, most importantly industry concentration, globalization, advancements in technology and automation, and the weakening of labor unions and workers in general. However, the tailwind from most of these reasons appears to be waning and may actually be turning into a headwind.
We are now seeing European and American regulators become more aggressive, particularly in the technology sector, to address concerns about industry concentration. For example, US regulators recently sued both Amazon and Google for monopolistic behavior, and the European Union started to enforce its Digital Services Act in an effort to restrain the power of large US tech companies.
Globalization has also taken a significant hit as tensions have risen between China and the western world. Tariffs placed by both Trump and Biden administrations have put a damper on US imports of Chinese goods. For the first eight months of 2023, the value US imports of Chinese goods is up only 2% over the same period in 2013, this despite a 60% expansion in the size of the US economy (both figures inclusive of inflation). Europe is also erecting barriers to trade with China, most recently with the announcement of an anti-subsidy investigation against Chinese automakers that many expect will result in higher import duties on Chinese electric vehicles.
The multi-decade decline in the power of US labor unions may have finally seen its end. This has been the summer of strikes, with Hollywood writers, and workers at United Parcel Service (UPS) and Kaiser Permanente winning major concessions from their employers. The United Auto Workers (UAW) union is currently expanding its walkouts against all three major US auto manufacturers, and Hollywood productions remain closed due to the actors strike. That said, the emergence of generative artificial intelligence (AI) could be the force to allow US corporates to continue its multi-decade expansion of operating margins.
Thus far I have only spoken of operating margins, that is the profit earned before paying taxes and interest on debt. Both of these expense lines are likely to go up in the coming years given the spike in interest rates and the large, and rapidly expanding US government debt burden (see below).
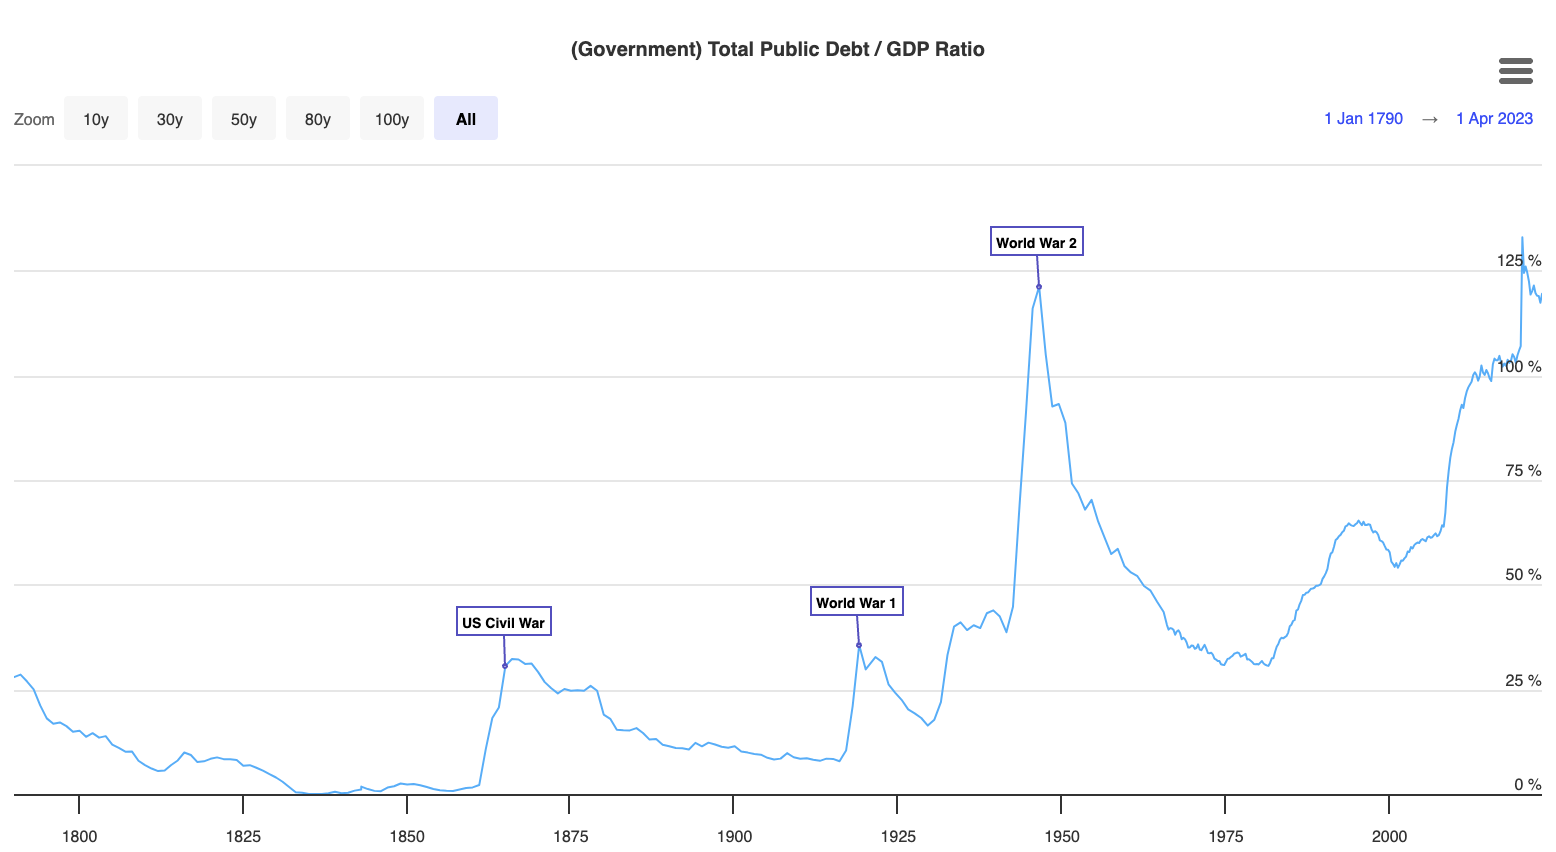
Source: Longtermtrends
If we expect US corporate margins to plateau, or dare I say decline, we would demand valuations at or below historical levels — not significantly higher as we are seeing today. While we don’t rule out continued margin expansion for US corporations, we think there is a significant probability that they will stall or fall from their current all-time highs.
3) High and persistent inflation

A shorter-term concern we have about US equities is if US inflation remains stubbornly high, and in turn, keeps interest rates higher for longer — an environment that will could eventually trigger a recession and decline in share prices. Although we have seen the CPI excluding food and energy fall to 4.2% from a peak of 6.6% a year ago, the next two percentage points decline will surely be more difficult. Adding to this challenge are a renewed spike in energy prices (see chart to left) and potential wage inflation coming out of the tight labor market and recent company concessions to labor unions.
We are starting to see consumer inflation expectations creep upwards again (see chart below), raising new concerns inflation could become entrenched.

4) International conflicts
There are always ongoing conflicts throughout the world, but today’s disputes and wars may pose the greatest threat to the global economy that we have seen since the end of the Cold War. As I write this, Israel is preparing to invade the Gaza Strip after Hamas militants launched attacks on Israeli civilians from the territory on 7 October. Although the immediate impacts of this conflict on the global economy have been modest, we fear that this could change if Iran decides to become more involved via Hezbollah, its well armed proxy in Lebanon.
Russia’s war against Ukraine is in its 20th month, with little forward progress being made by either side. This conflict has ignited a new cold war between Russia and the West, destroying the “peace dividend” both enjoyed over the last three decades. More resources will allocated to “non-productive” defense going forward, denting long-term growth of the global economy.
Of even greater economic significance, but fetching fewer news headlines, is the growing tension between China and the western world. Although not reaching the level of a cold war just yet, the West has been slowly disengaging from China economically as I noted previously in this section. This disengagement process would rapidly accelerate should China decide to take Taiwan by force, as it has increasingly threatened.
5) Dysfunctional government Infighting among House Republicans nearly triggered a breach of the debt ceiling in June and a federal government shutdown earlier this month. Both events would have harmed to the US economy, especially the debt ceiling breach. In reaction to the six-week bipartisan stop-gap budget deal to keep the government running through mid-November, a small faction of far-right House Republicans successfully ousted Kevin McCarthy from his position as House speaker, an historic first. As of this writing, House Republicans have yet to fill this vital position, paralyzing Congress.
The prospects of the House passing a more permanent budget deal by the mid-November deadline appear slim. If the Republicans elect a far-right member to be House speaker, like current front-runner, Jim Jordan, they will likely put forward a budget that House Democrats and more moderate Republicans will vote down, and that the Democratically-controlled Senate will very likely reject.
The initial front-runner for the speaker position, Steve Scalise, a moderate Republican, failed to win the position as both Democrats and far-right Republicans voted against him. One possible path through this approaching budget impasse is if moderate Republicans team up with Democrats to elect a moderate Republican as House speaker, and then to pass a centrist budget that both moderate House Republicans and Democrats support. I have no idea how this will all play out, but I do believe there is a real possibility of a painful and long government shutdown later this year.
So in recap, we see the US equity market priced near to perfection with many obstacles that could derail it, both in the short and long term. Within global equities, we prefer overseas markets which also have their own long list of issues, but at least they are priced much more cheaply and have lower operating margins (i.e. margins that are more likely to expand than to stall or contract). We are modestly underweight global equities as a category, relative to our benchmarks.
PERFORMANCE DISCUSSION
Third Quarter
All AlphaGlider investment strategies outperformed their respectively benchmarks during the third quarter. Our most conservative strategies fell approximately 35% less than their benchmarks while are most aggressive strategies fell approximately 15% less. We benefited from being modestly underweight equities during the quarter, which did poorly in most regions. Fixed income performed equally as bad, however our neutral weighting was skewed to shorter durations which helped as rates continued to rise.
Our absolute best performing security was our long/short US equity (i.e. US market neutral) mutual fund. It was up 8%, well ahead of its own cash benchmark of a tad over 1%. Other relative winners for our strategies were US value and Singaporean equities, as well as international bonds.
Our investment strategies were held back in the third quarter by their overweight international equity exposure, particularly in developed markets. While US equities were relative out-performers, our US small cap and high quality stocks were not among them. And our more aggressive core strategies were hurt by their US technology company exposure. Our ESG strategies were hurt by their lack of fossil fuel energy exposure, and the exposure to clean energy companies in our more aggressive ESG strategies.
The following are individual funds that particularly helped, and hurt, our strategies’ performance during the quarter relative to our equity and bond index benchmarks (MSCI ACWI IMI -3.4% & Bloomberg US Aggregate Bond -3.2%):
Significant Relative Benefactors in 3Q23:
+8.0% Vanguard Market Neutral, VMNFX
+1.3% Invesco Short Term Treasury, TBLL
+0.7% Vanguard Short-Term Treasury, VGSH
+0.4% Vanguard ST Inflation-Protected Securities, VTIP
+0.1% iShares ESG 1-5 Yr Corporate Bond, SUSB
+0.1% Vanguard Short-Term Corporate Bond, VCSH
-0.9% iShares MSCI Singapore Capped, EWS
-1.3% Vanguard Total International Bond, BNDX
-2.3% Vanguard Value, VTV
Significant Relative Detractors in 3Q23:
-20.5% iShares Global Clean Energy, ICLN
-5.7% Fidelity MSCI Information Tech, FTEC
-4.7% SPDR Portfolio Developed World ex-US, SPDW
-4.6% Vanguard ESG International Stock, VSGX
-4.6% Vanguard Small-Cap, VB
-4.0% Vanguard Mortgage-Backed Securities, VMBS
Last 12 Months
AlphaGlider’s investment strategies generally performed in line with their respective benchmarks over the last year, with our more conservative strategies doing slightly better than their benchmarks while our more aggressive strategies doing slightly worse.
During this last year of rising rates, the active positioning that most paid off for our strategies was to run our fixed income sleeves with short duration. Our long/short US equity mutual fund, which we benchmark against cash, also performed well over this time period. On the equities side, our strategies were helped by their overweight positioning in foreign developed companies. Our more aggressive strategies were helped by their US technology fund which was up 36%.
Most of our under-performers were from overseas, most notably emerging market and Singaporean equities. Our international REITs also struggled. In the US, our value, quality, and small cap holdings underperformed the overall US stock market. As in the third quarter, our ESG strategies were hurt by their lack of fossil fuel energy exposure, and our more aggressive ESG strategies’ exposure to clean energy companies.
The following are individual funds that particularly helped, and hurt, our strategies’ performance during the last 12 months (LTM) relative to our equity and bond index benchmarks (MSCI ACWI IMI +20.2% & Bloomberg US Aggregate Bond +0.6%):
Significant Relative Benefactors over LTM:
+36.3% Fidelity MSCI Information Tech, FTEC
+24.0% SPDR Portfolio Developed World ex-US, SPDW
+13.3% Vanguard Market Neutral, VMNFX
+4.3% Invesco Short Term Treasury, TBLL
+4.0% Vanguard Short-Term Corporate Bond, VCSH
+3.8% iShares ESG 1-5 Yr Corporate Bond, SUSB
+3.4% Vanguard ST Inflation-Protected Securities, VTIP
+2.4% Vanguard Short-Term Treasury, VGSH
Significant Relative Detractors over LTM:
-22.8% iShares Global Clean Energy, ICLN
+3.0% Vanguard Global ex-US Real Estate, VNQI
+11.0% Vanguard Emerging Markets, VWO
+11.1% Nuveen ESG Large-Cap Value, NULV
+12.1% iShares ESG Aware MSCI EM, ESGE
+12.4% iShares MSCI Singapore Capped, EWS
+12.6% Vanguard Small-Cap, VB
+14.7% Vanguard Value, VTV
+14.9% Vanguard Small-Cap, VB
+15.6% Vanguard Dividend Appreciation, VIG
OUTLOOK & STRATEGY POSITIONING
With stocks and bonds selling off by similar amounts, our thinking about the markets and our investment strategies did not change much during the quarter. We kept the positions and their sizes static in all strategies and with little new investment thinking to report, I thought I would dedicate this usually forward looking section of the CIO Commentary to some housekeeping items about various topics, notably the recent transition from TD Ameritrade Institutional to Schwab.
1) TBLL
You might have noticed a new fund in your accounts this quarter which seems to contradict my above statement that there were no changes to our investment strategies. However, this “new” fund, Invesco Short Term Treasury (TBLL) is actually just a new name for one of our existing holdings, Invesco Treasury Collateral (CLTL). Invesco did not make any changes to the underlying holdings of the fund, nor the methodology used to manage it.
2) I Bonds
In a late 2021 blog post I recommended my readers to buy I Bonds in order to take advantage of their 7.12% annualized interest rate. But with inflation coming down, the interest rate paid by I Bonds has been steadily falling. In my Q2 CIO Commentary I recommended that I Bonds bought in the last 2021 and early 2022 timeframe be sold just after their interest rates would be reset to 3.38% in late September/early October. That time has now passed so if you have not already done so, get out there and sell as you can get 4%+ from high-yield savings accounts and 5%+ from short-term Treasuries such as those held by TBLL.
3) Fund management fee reductions
We’re used to seeing the management fees of AlphaGlider investment strategies decline due to fee reductions from Vanguard, but this quarter we were helped out by fee reductions from State Street and Schwab.
State Street reduced its management fee for SPDR Developed World Ex-US (SPDW) by 25% to 3bps (0.03%). SPDW is the largest weighted stock fund in our core strategies and now sports a management fee that is 40% lower than the comparable fund from Vanguard (VEA). Developed international equities is one of the rare fund categories in which Vanguard competes but does not have the lowest cost offering.
Schwab also reduced its management fee for Schwab US TIPS (SCHP) by 25% to 3bps. Vanguard does not have an offering in the medium duration inflation-protected Treasuries (TIPS) space, but the two other large exchange-traded fund houses do. iShares’ offering (TIP) has a management fee of 19bps (6x higher), and State Street’s offering (SPIP) is 12bps (4x higher).
Management fees are very important in our fund selection process, but other factors like liquidity, bid-ask spreads, premium/discount to net asset value (NAV), index followed, tracking error to index, and fund turnover are also criteria that we consider we choosing funds for AlphaGlider investment strategies.
4) Schwab transition
The planned transition from TD Ameritrade Institutional (TDAI) to Schwab occurred over Labor Day weekend as planned. On the whole the transition went smoothly, both for us as well as other registered investment advisors.
By now I hope all of my clients have set up their Schwab login credentials so that they can access their investment accounts on the web at schwab.com and with the Schwab mobile app (iOS & Android). Note that each account owner in a household will need to set up their own Schwab login credentials. However, it is easy to provide view-only access to their partner which is especially convenient if they are the one who primarily monitors finances in the household. To do this, click on the “Add View-Only Access” link on the landing page after logging into your account. Note that if you previously had a Schwab login credential (e.g. if you have a self-directed account at Schwab or were using Schwab before becoming an AlphaGlider client), you should use that login to see your AlphaGlider-managed accounts. Please reach out to me if this is not the case.
I hope that you have found Schwab’s web and mobile app interfaces to be intuitive. Now that September is over, you can access your monthly account statements, but only at schwab.com (not at TDAI or on the Schwab mobile app). Once you log in, you can find the statement by selecting the “Statements” link near the top of the page. For September you should have received two statements for each of our accounts, one from Schwab and one from TDAI, with the latter showing a zero balance and no positions. Although the formatting is a little different, the information presented in Schwab’s statements is nearly identical to that in TDAI’s statements. Please reach out to me if you want me to explain any of the information that you see in your Schwab statements.
Finally, there’s the topic of money into and out of your investment accounts. For your taxable investment accounts, there is no change from the processes we had at TDAI — once you link your investment account with your external checking account for ACH transfers (note that all existing links established at TDAI moved over to Schwab in the transition), all you need to do is contact us to request a cash transfer into or out of your investment account and we will put it in motion. The same goes with distributions from retirement accounts. However, the process to make contributions to retirement accounts has changed significantly. ACH transfers cannot be used at Schwab for retirement account contributions like we did at TDAI. Instead, there are several other options, all a bit less convenient and cheap than the ACH transfers we had at TDAI. Next time you plan to make a contribution to your AlphaGlider-managed retirement account, please contact me to review your options well ahead (e.g. two weeks) of your deadline if possible.
**NOTES & DISCLOSURES**
1This material represents an assessment of the market and economic environment at a specific point in time and is not intended to be a forecast of future events, or a guarantee of future results. Forward-looking statements are subject to certain risks and uncertainties. Actual results, performance or achievements may differ materially from those expressed or implied. Information is based on data gathered from what we believe are reliable sources. It is not guaranteed as to accuracy, does not purport to be complete, and is not intended to be used as a primary basis for investment decisions. It should also not be construed as advice meeting the particular investment needs of any investor.
2Mutual funds, exchange-traded funds and exchange-traded notes are sold by prospectus. Please consider the investment objectives, risks, charges, and expenses carefully before investing. The prospectus, which contains this and other information about the investment company, can be obtained directly from the Fund Company or your financial professional. Be sure to read the prospectus carefully before deciding whether to invest.
3Alternative investments, including hedge funds, commodities and managed futures involve a high degree of risk, often engage in leveraging and other speculative investments practices that may increase risk of investment loss, can be highly illiquid, are not required to provide periodic pricing or valuation information to investors, may involve complex tax structures and delays in distributing important tax information, are subject to the same regulatory requirements as mutual funds, often charge higher fees which may offset any trading profits, and in many cases the underlying investments are not transparent and are known only to the investment manager. The performance of alternative investments including hedge funds and managed futures can be volatile. Often, hedge funds or managed futures account managers have total trading authority over their funds or accounts; the use of a single advisor applying generally similar trading programs could mean lack of diversification and, consequently, higher risk. There is often no secondary market for an investor’s interest in alternative investments, including hedge funds and managed futures and none is expected to develop. There may be restrictions on transferring interests in any alternative investment. Alternative investment products including hedge funds and managed futures often execute a substantial portion of their trades on non-US exchanges. Investing in foreign markets may entail risks that differ from those associated with investments in the US markets. Additionally, alternative investments including hedge funds and managed futures often entail commodity trading which can involve substantial risk of loss.
4Rebalancing can entail transaction costs and tax consequences that should be considered when determining a rebalancing strategy.
^Indices are unmanaged and investors cannot invest directly in an index. The performance of indices do not account for any fees, commissions or other expenses that would be incurred.
aThe Standard & Poor's 500 (S&P 500) Index is a free float-adjusted market capitalization weighted index that is designed to measure large cap US equities. The index includes 500 leading companies and captures approximately 80% coverage of available market capitalization in the US equity markets.
bMSCI Europe, Australasia and Far East (EAFE) Index is a free float-adjusted market capitalization weighted index that is designed to measure the investable universe of developed market equities outside of the US.
cMSCI Emerging Markets (EM) Index is a free float-adjusted market capitalization weighted index that is designed to measure large and mid-cap equity market performance in the global Emerging Markets.
dMSCI All-Country World (ACWI) Investable Market Index (IMI) is a free float-adjusted market capitalization weighted index that is designed to measure the investable universe of global equity markets.
eThe Bloomberg Barclays US Aggregate Bond Index is a market capitalization weighted index that is designed to track most investment grade bonds traded in the United States. The index includes Treasury securities, government agency bonds, mortgage-backed bonds, corporate bonds and a small amount of foreign bonds traded in the United States. Municipal bonds and Treasury Inflation-Protected Securities (TIPS) are excluded due to tax treatment issues.
Copyright © 2023 AlphaGlider LLC. All Rights Reserved.
No part of this report may be reproduced in any manner without the express written permission of AlphaGlider LLC.