
Photo by Ed Us
INVESTMENT ENVIRONMENT1
Source: Orion Advisor Services, AlphaGlider
The five quarter streak of strong performance from the world’s equity markets came to an end in the third quarter of 2021. Our global equity index, MSCI ACWI IMI,^d declined -1.1%, with emerging markets doing most of the damage — the MSCI Emerging Markets Indexc was down -8.1%. The S&P 500,a the index of the 500 largest US companies, was able to eke out a 0.5% gain. Nevertheless, stock market gains from most corners of the world were extremely strong over the last twelve months. Our fixed income index, the Bloomberg Barclays US Aggregate Bond,e was relatively flat during the quarter, as well as for the last year.
The delta variant of SARS-CoV-2, the virus that causes COVID-19, accelerated its spread throughout the world during the quarter. In the US, delta triggered the third major wave of COVID-19 infections, hospitalizations, and death. Approximately 100,000 Americans died from COVID-19 in the third quarter, taking the cumulative toll for the disease over 700,000. The three approved vaccines, widely available in the country since late spring, have proven to be highly effective in preventing hospitalization and death (see CDC charts below). However, just under two-thirds of the eligible US population (age 12+) were fully vaccinated exiting the quarter, primarily due to vaccine hesitancy/refusal in parts of the population.

Source: The Washington Post
COVID-19’s resurgence in the third quarter dented the global economic recovery, including in the US. Hiring in the US slowed significantly in August and September (see chart to right), the result of many factors including slower than expected economic growth, supply chain constraints (factories going idle because of parts and raw materials shortages), and a shrinking available workforce (COVID keeping prospective workers at home to avoid getting sick, or to take care of children who got sick at school). Despite wages increasing by 0.6% from August to September (and 4.6% over the last year), the available workforce fell by 183,000 from August to September, and now stands 3.1 million below its level in February 2020, just before the pandemic hit the US.

Source: Yardeni Research
Related to robust wage growth, inflation continues to run hot in the US (see the chart of three common measures of inflation to the left). While Fed officials still maintain that inflation is likely transitory, they are bringing forward plans to remove the punchbowl from the party, i.e. to roll back their easy monetary policies. A year ago the Fed forecasted inflation of 1.8% in 2022, but its most recent forecast is for 2.3%. Just six months ago, a majority of Fed officials believed that they wouldn’t raise rates until 2024, however now half of them think it will happen by late next year. But before the Fed begins to raise rates, it has indicated that next month it will begin to “taper” its current $120 billion per month quantitative easing program down to zero. The removal of this large, price insensitive forced buyer of bonds and mortgages, and the prospect of Fed rate hikes next year, provides a stiff headwind for fixed income securities over the coming year.
On the US political front, divisions between the left and the centrist Democrats in Congress have prevented the passage of the $1 trillion bipartisan infrastructure bill, as well as Biden’s 10-year, $3.5 trillion budget plan loaded with climate and social safety net programs. Dealing with the debt ceiling, now set to be hit in December, will also be a priority for Congress in the coming quarter. We will be following the developments on each of these three issues closely as they all have the potential to move markets, in both directions.
Shifting overseas, 136 countries representing over 90% of the global economy signed an agreement to set a global minimum corporate tax rate of 15% for large multinational companies beginning in 2023. The Organization for Economic Cooperation and Development (OECD) estimates that the agreement will allow for the collection of approximately $150 billion in addition tax revenue annually — much of this from large US technology, pharmaceutical, and financial companies which currently run elaborate tax schemes to lower their total tax paid. My first back of the envelope swag of the impact on the value of the S&P 5002 puts the downside at about 6% — assuming two thirds of the $150 billion additional tax is collected from S&P 500 companies, the index maintains its 21.8x forward price-to-earnings multiple, and a current S&P 500 market capitalization of $36.54 trillion: ($150 billion x 2/3 x 21.8) / $36.54 trillion = 6%. Some of this news may already be incorporated into current share prices, but with the S&P 500 up nearly 30% over the last year, we suspect that it hasn’t.
PERFORMANCE DISCUSSION
AlphaGlider investment strategies generally outperform during down quarters, however the third quarter of 2021 was an exception. The primary drivers of this underperformance was our strategies’ overweight position in poorly performing emerging market equities (Vanguard FTSE Emerging Markets, VWO,2 -7.0%; iShares ESG Aware MSCI EM, ESGE, -8.2%) and underweight position in US equities (S&P 500, +0.5%) which held solid. Within our foreign equity holdings, our European and Singaporean funds were also relative underperformers (Vanguard FTSE Europe, VGK, -1.9%; iShares MSCI Singapore Capped, EWS, -2.0%). Within our US equity holdings, our value funds were relative underperformers (Vanguard Value, VTV, -1.0%; Nuveen ESG Large-Cap Value, NULV, -0.7%). Our physical gold fund also disappointed (SPDR Gold MiniShares, GLDM, -0.9%).
On the positive side, our healthy overweighting of inflation-protected securities (Schwab US TIPS, SCHP, +1.9%; Vanguard ST Inflation-Protected Securities, VTIP, +1.3%) has been a consistent strong contributor to AlphaGlider strategies’ performance over the last few years, and the recently completed quarter is no exception. Our more aggressive strategies benefited from their holdings in technology equities (Fidelity MSCI Information Technology, FTEC, +0.9%).
The story for the drivers of AlphaGlider strategy performance over the last 12 months is similar to what we saw in this past quarter. We were hurt by our overweight positions in emerging market equities (VWO +18.3%; ESGE +17.9%) and physical gold (-7.1%), and by our underweight position in US equities (S&P 500, +29.4%). We benefited from our overweight position in inflation-protected securities (SCHP, +5.2%; VTIP +5.5%). But unlike in the third quarter, our US value funds were among our best investments (VTV +32.6%; NULV +30.8%).
OUTLOOK & STRATEGY POSITIONING
We made a few changes to the AlphaGlider investment strategies during the quarter. The first was to lower the sensitivity of our fixed income holdings to interest rate changes by lowering their duration. We made this change to lower our downside risk should inflation run higher for longer. The effective duration of our strategies now ranges between 4.7 to 5.1 years, below that of our fixed income benchmark’s 6.5 years. Should inflation, and in turn interest rates, overshoot what the market is expecting, we anticipate that our fixed income positions will fall less than that of our benchmark.
We also moved to reduce exposure to fixed income in our more aggressive investment strategies such that all of our strategies are now running fixed income position sizes that are equal to or smaller than that of our strategies’ benchmarks. This move was precipitated by the extraordinarily low real (i.e. after inflation) rates offered by bonds. For most of the last 15 months, a buyer of a 10-year Treasury has been willing to have the expected purchasing power of their investment decline by nearly 1% per year for each of the next 10 years — see the chart below. Unsurprisingly, there aren’t many takers for this deal, aside from of the Fed which has different motives and objectives than you and me.

Source: Federal Reserve Bank of St. Louis
Although there’s nothing to say that negative real rates cannot continue or even worsen in the future, conventional economic wisdom points to rising real rates going back into positive territory sooner than later. By definition, real rates (nominal rates minus expected inflation, each for a given time frame) can go higher for two reasons: 1) nominal rates go up from here (currently 1.52% for the 10-year Treasury) and/or 2) inflation expectations fall from here (currently 2.43% for the 10-year breakeven inflation rate). If nominal rates go up, bond prices will fall (and longer duration bonds will fall harder) and high priced growth stocks (e.g. many of the largest stocks in the S&P 500) will likely struggle relative to the broader market. If inflation expectations fall, it’s unclear which way nominal rates go given their current low level, but high priced growth stocks will likely benefit.
Bottom line, we think most bonds are overvalued here. They present significant downside risk and little upside risk. We still maintain some exposure to the asset class though (but underweight relative to our benchmarks) in order to provide diversification to our stock holdings, and as a store of dry powder to buy stocks if we enter into another bear market.
With the funds generated by the sale of bonds in our more aggressive strategies, we established a new position in a US consumer staples equity fund. Although far from cheap, we find the consumer staples sector to be more attractively valued than the broader market, and expect it to hold up better in a market selloff.
We also increased the size of our overweight emerging market equities position. As highlighted in the previous sections of this commentary, emerging markets were beaten up this quarter, down -8.1%. Chinese equities, which made up nearly 40% of the MSCI Emerging Markets Index at mid-year, were the driver of the poor performance. Chinese equities were down -18.1% during the quarter as measured by the MSCI China Index. f
The Chinese equity market, like many other emerging markets, is notoriously volatile and subject to unexpected actions by government officials. This was the case this summer when Chinese regulators targeted several segments of its economy, negatively affecting the prospects of many large Chinese internet, education, and online gaming companies. Chinese stocks also took a hit near the end of the quarter when the country’s second largest property developer, The Evergrande Group, teetered near bankruptcy.
After taking this black eye, it’s important to remember that volatility in the Chinese equity market works both ways and that periods of strong performance often follow periods of weak performance. The chart below shows this, and also shows that the magnitude of this recent selloff is nothing unusual for China.
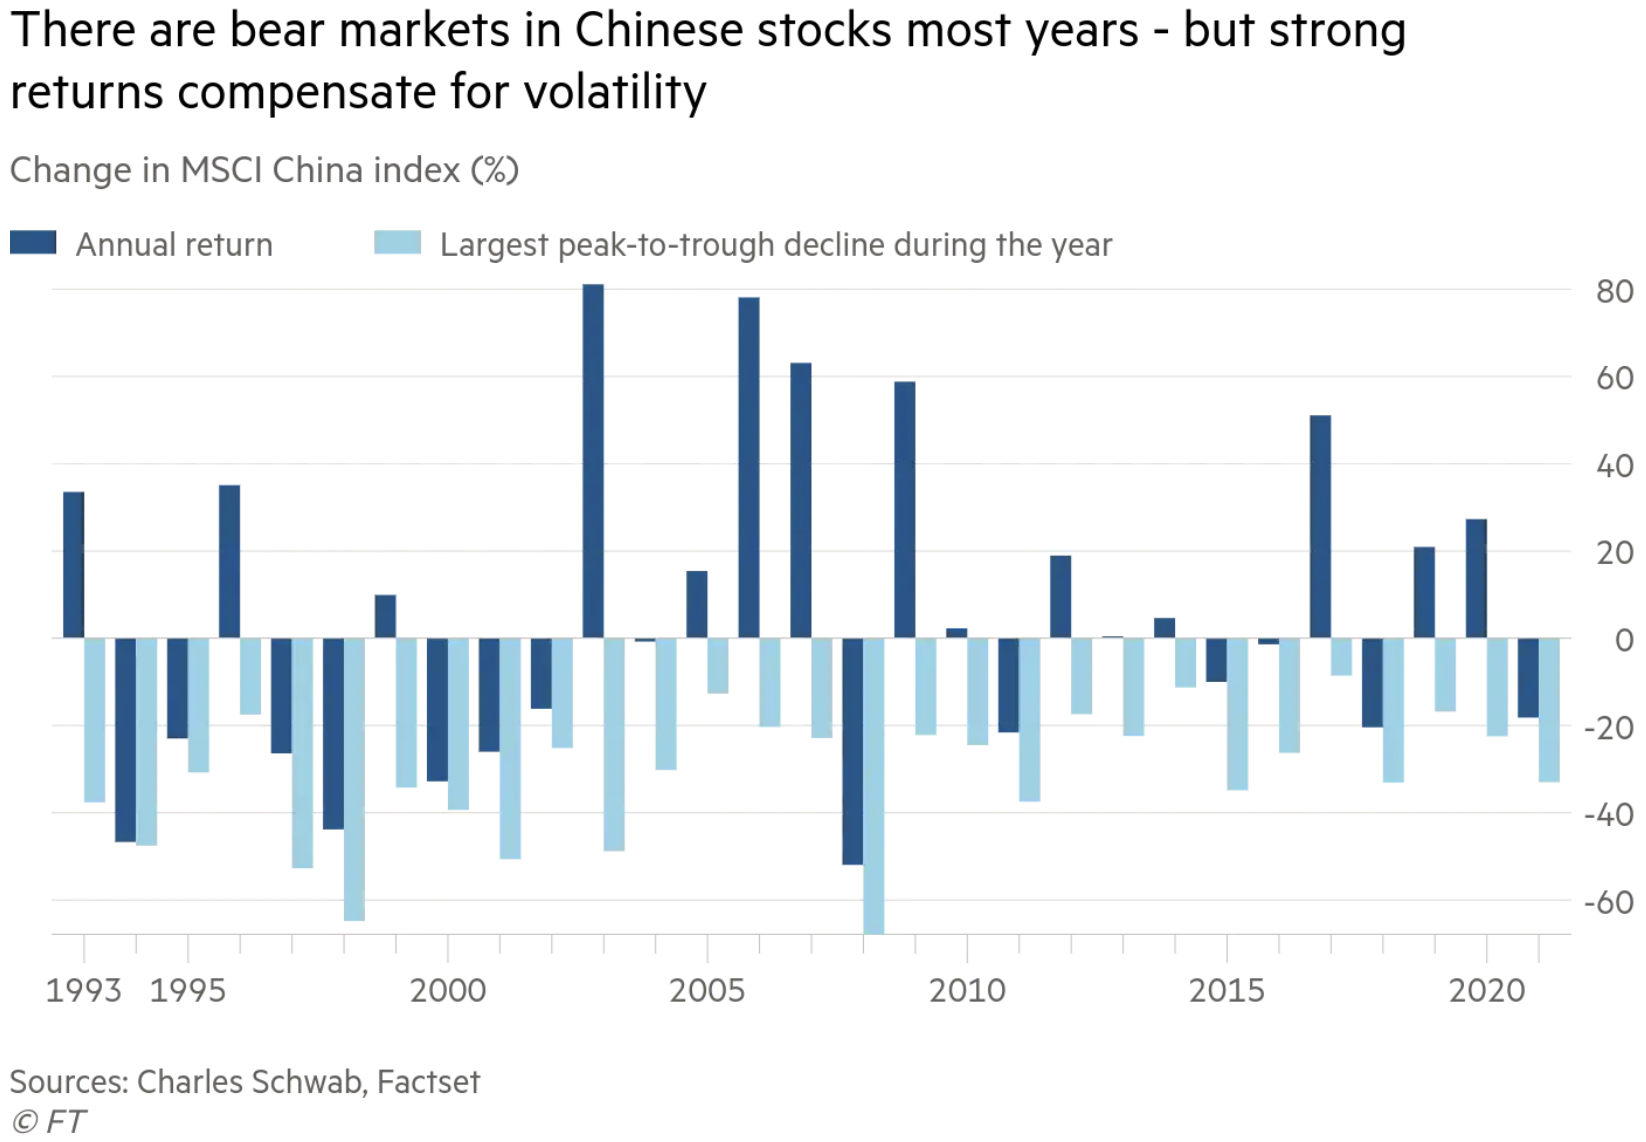
Source: Financial Times
It’s been a bumpy road for investors in the Chinese equity market, but the rewards for those who have stuck it out have been rewarded handsomely. Over the last 20 years, the MSCI China Index has generated an annualized total return of 12.3%, 300bps more than that generated by the S&P 500.
I preach the importance of having a long-term investment perspective, something that is especially true in China and the rest of the emerging markets. We exercised some of that perspective this quarter by buying more emerging market equities after the selloff in the Chinese equity market. We are pleased to be running overweight positions in emerging markets which are trading on a cyclical adjusted price to earnings ratio (CAPE) of approximately 15.5x, near its long term average. In contrast, we’re fine to remain underweight the US equity market, whose CAPE is above 37x (at the 99th percentile of its historic range).