
PHOTO CREDIT: The White House
View a downloadable version of this blog entry »
INVESTMENT ENVIRONMENT1
Source: Orion Advisor Services, AlphaGlider
The third quarter of 2019 saw a steep decline in forward expectations for US and global growth, and in turn, dramatically lower bond yields. The yield on the US 10-yr Treasury fell 39 percentage points (bps) over the quarter (and 144bps over the last 12 months) to finish at 1.64%. As bonds prices increase when their yields fall, it’s unsurprising that bonds, and assets positively correlated with them, were the quarter’s big winners. Our benchmarks’ fixed income index, the Bloomberg Barclays US Aggregate Bond Index^e returned 2.3% during the quarter while our global equity index, MSCI All-Country World Equity Indexd fell 0.2%.
As with the first half of the year, US equity markets outperformed their international peers. The US market, as measured by the S&P 500a, was up 1.7% in Q3 versus a 1.1% decline in developed markets (MSCI EAFEb) and a 4.3% decline in emerging markets (MSCI EMc).

Source: Institute of International Finance, AlphaGlider
The Federal Reserve (Fed) made two 25bps cuts to its funds target rate during the quarter, bringing its range to between 1.75% and 2.0%. As the chart on the left demonstrates, the Fed policy makers’ median projections of future Fed funds target rates fell dramatically over the last 12 months (150bps lower for the rate in late 2020). The chart also shows that Fed policy makers believe the economy is sufficiently stable to not require any further cuts — a viewpoint the market doesn’t share. Investors expect the Fed to cut rates again at its final two meetings of the year.
On a related note, we saw the shortest Treasury (1-month) become the highest yielding Treasury of any duration during the quarter. Although much has been made of inverted yield curves foreshadowing recessions, the relationship between inverted yield curves and falling equity prices is also a strong one. The chart below shows the three times that the 1-month was the highest yielding Treasury: when the dotcom bubble was popping in 2000/1, during the formation of the real estate bubble in the mid-2000s, and now, this quarter.

Source: @OddStats, AlphaGlider
The US employment picture continues to remain strong with only 3.5% unemployment exiting the quarter. US consumer spending and confidence also continue at high levels, but some forward looking indicators are concerning.

Source: The Daily Shot
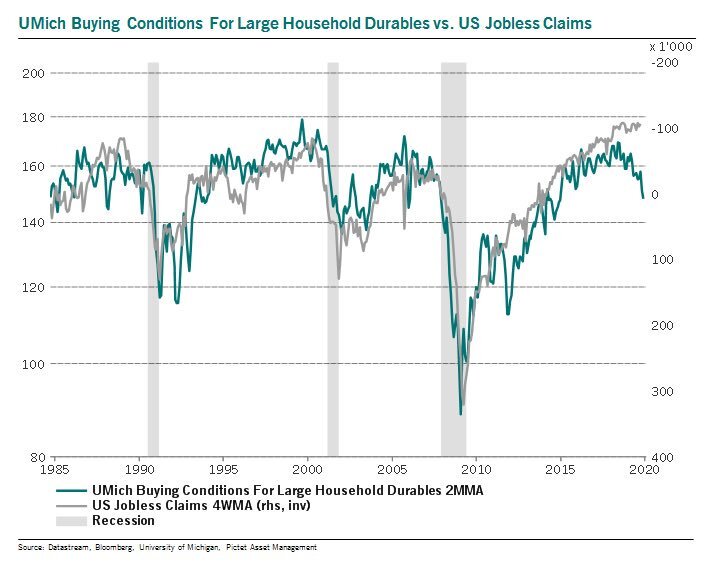
The gap between the Conference Board’s measure of current consumer confidence versus expectations continues to widen, indicating we may be in the late stages of the current economic expansion (see chart to right). Similarly, the University of Michigan’s Survey of Consumers measures of conditions for home purchases and large household durables indicate trouble ahead for the housing and job markets (see chart below).
Source: Pictet Asset Management

Source: Renaissance Macro
While US consumer behavior may be showing us early signs of an impending recession, the US manufacturing sector appears to already be in recession. The Institute for Supply Management (ISM) Purchase Managers’ Index (PMI) measure of manufacturing activity contracted (went below 50) during Q3. The even steeper decline in new export orders foreshadows another significant step down in US manufacturing in Q4 (see chart below).

Source: Deutsche Bank, AlphaGlider

Source: Nordea, AlphaGlider
Although manufacturing makes up less than 12% of the US gross domestic product (GDP) according to the Bureau of Economic Analysis (BEA), manufacturing is highly correlated with GDP growth and the stock market. The chart to the right shows that Markit’s PMI measure has been a strong predictor of future GDP growth over the last decade. If the PMI continues to follow exports orders down and the correlation between PMI and GDP continues, we may see the US economy fall into recession in early 2020. Finally, the chart below shows the linkage between ISM’s PMI measure and subsequent 12-month returns for the US stock market (as measured by the S&P 500). Despite all of these worrying indicators, the S&P 500 returned 1.7% during the quarter, besting both developed and emerging market stock markets.

Source: Bloomberg

Source: Oxford Economics, AlphaGlider
The rising fears of recession, central bank rate cuts, and falling bond yields in the US and around the world, come against the backdrop of the trade war between the US and China. During the third quarter, the US applied a new 15% tariff on $110 billion in annual Chinese imports, adding to the 25% tariffs already applied to $250 billion in imports. On 11 October, Trump announced a “Phase 1” freeze in trade war escalations with China — pulling back his threat to increase the 25% tariff on $250 billion in imports to 30% on 15 October, and his threat to impose a new 15% tariff on the remaining $190 billion in imports not yet taxed on 15 December. In exchange, Trump claims that China agreed to buy $40-50 billion in American agricultural products annually, to abide by undisclosed guidelines on how China manages its currency, to strengthen intellectual property protections, and to further open its financial services sector to American firms. However, the agreement is far from complete and will require weeks more of negotiations before written terms can be signed. Even if they can reach an agreement, US consumers will still be saddled with more than a tripling in import taxes relative to pre-trade war levels.
Although nowhere near the scale of the US-China trade conflict, trading relations between the US and the European Union (EU) deteriorated during the quarter. The US announced it would levy 10% tariffs on imported Airbus aircraft and 25% tariffs on a slew of European goods such as French wines and Scottish whiskies (for a total of $7.5 billion in annual imports) in mid-October. Unlike all of the US tariffs against China and the US tariffs against EU steel and aluminum tariffs, these new tariffs were authorized by the World Trade Organization (WTO) for illegal subsidies the EU made to Airbus over the previous decades. The WTO also determined that the US illegally subsidized Boeing at a similar magnitude, but the EU has held back from applying penalties against the US. Trade relations between the US and the EU could deteriorate even further in the coming quarter as the Trump administration comes up against its self-imposed deadline to determine what actions to take against the EU in light of its determination that car imports threaten US national security.

Source: Clay Jones
US House Speaker Nancy Pelosi launched formal impeachment proceedings against President Trump after a whistleblower from the US intelligence-community accused Trump of withholding nearly $400 million in military aid and official state meeting invitations to pressure Ukraine to pursue a probe that could benefit Trump politically. Gauging by the muted effect that this news has had on the US stock market, it would appear that investors assign little probability to Trump being removed from office either by House impeachment and Senate acquittal, or via the 2020 election.
Source: Bloomberg
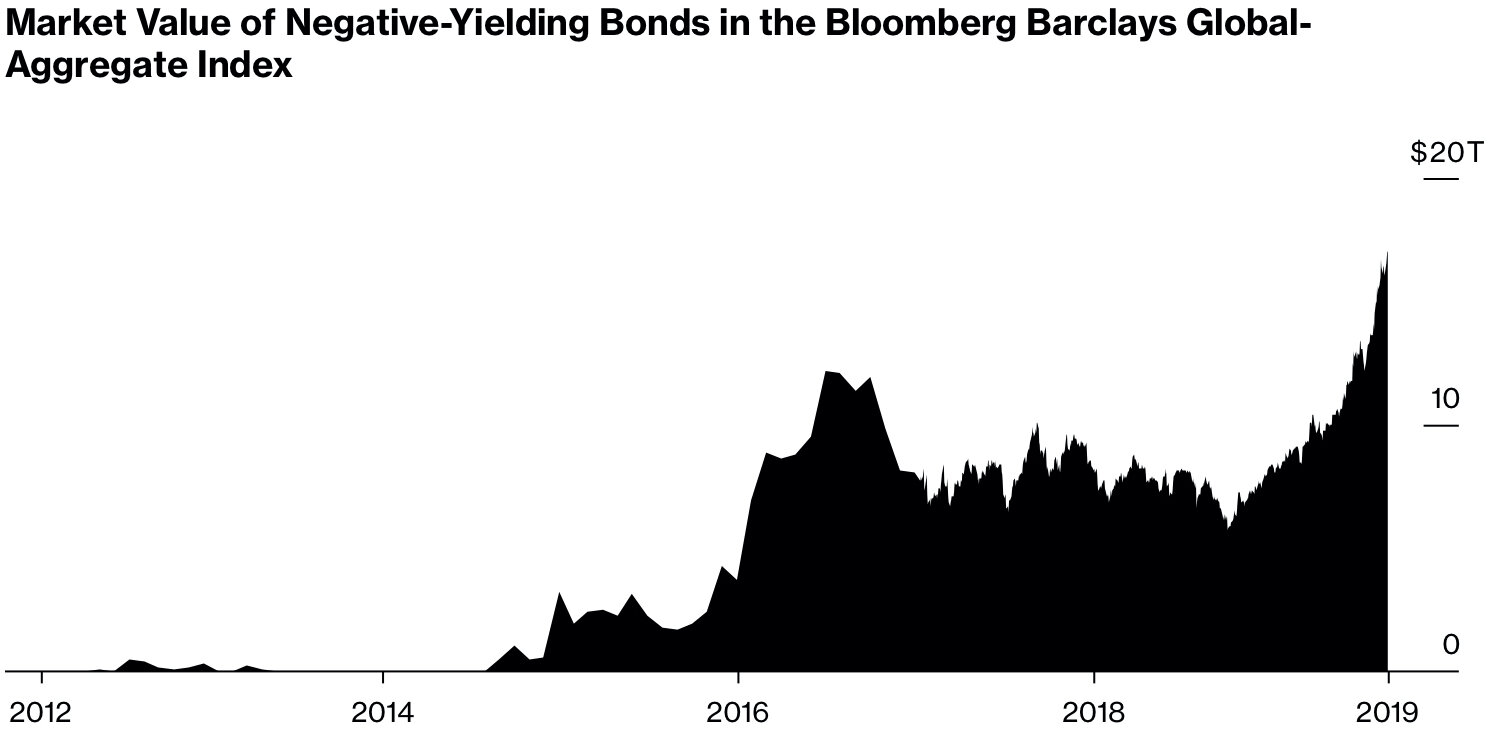
Moving away from the US, we saw that the collapse in bond yields was not just a US phenomena, but also a global one. At one point during the quarter, approximately 30% of all investment-grade debt securities in the developed world had negative yields — over $17 trillion in total. Most of this debt was issued by Japanese and European governments.
The convoluted drama that is Brexit continued for yet another quarter. Boris Johnson, the new prime minister of the United Kingdom (UK), tried to strong-arm Parliament to allow the UK to leave the EU without a trade deal in place. However, Parliamentary action and a UK Supreme Court ruling prevented Johnson’s plan. Johnson then quickly negotiated a Brexit framework with the EU that would have allowed the UK to exit by the 31 October withdrawal deadline, but Parliament refused to be rushed into voting on it. As it currently stands, the withdrawal deadline will likely be pushed out to 31 January and Parliament will be given more time to examine Johnson’s Brexit framework before voting on it. Uncertainty about the future trading relationship between the UK and the EU continues to plague British and European businesses.

Source: Nasdaq
The tense standoff between Iran and US, and their various allies, continued in the quarter. On 14 September, Saudi Arabia’s oil production was temporarily halved after its primary crude oil processing facility in Abqaiq and its Khurais oil field were struck by missiles and drones, apparently of Iranian origin. Less than a month later, an Iranian oil tanker was hit by two missiles near Jeddah, a Saudi port city on the Red Sea — which Iran blamed on the US, Israel, and Saudi Arabia. However, oil prices remained relatively stable as fears of a global economic slowdown offset concerns over oil supply disruptions.
PERFORMANCE DISCUSSION
With fixed income outperforming equities during the third quarter, AlphaGlider’s more conservative strategies outperformed its more aggressive ones. The range of Q3 returns was -0.4% for AlphaGlider’s Aggressive composite (a composite is the asset-weighted average of portfolios run according to a particular strategy), to +0.9% for AlphaGlider’s Conservative composite.
AlphaGlider strategies lagged their respective indexes during the quarter (they ranged from +0.1% for Aggressive benchmark to +1.8% for Conservative benchmark), primarily due to the short duration of our fixed income positions and to the underweight US/overweight emerging markets positioning within our equity holdings. Besides this detrimental macro exposure, AlphaGlider strategies were hurt by their positions in Singaporean equities (-6.1%, EWS, iShares MSCI Singapore Capped),2 US Energy equities (-5.5%, FENY, Fidelity MSCI Energy; not present in ESG strategies), and US healthcare equities (-3.3%, FHLC, Fidelity MSCI Health Care). AlphaGlider’s best performing holdings were all US equities: consumer staples (+6.0%, FSTA, Fidelity MSCI Consumer Staples), consistent dividend growers (+4.2%, VIG, Vanguard Dividend Appreciation), and value (core strategies: +2.8%, SPYV, SPDR Portfolio S&P 500 Value; ESG strategies: +3.3%, NULV, Nuveen ESG Large-Cap Value). AlphaGlider’s ESG strategies slightly outperformed their Core strategies peers, mostly due to their avoidance of poorly performing energy stocks.
The relative winners and losers for the year-to-date period were similar to those for the third quarter, and frankly, similar to those over the last decade. Long duration fixed income securities and US equities performed very well, while foreign equities and shorter duration fixed income performed only modestly well. AlphaGlider strategies were caught on the wrong side of this mix this year. Our composites were up between 6.6% to 11.4% (Conservative to Aggressive), whereas their respective benchmarks were up 10.1% to 15.2%.
OUTLOOK & STRATEGY POSITIONING
Our absolute performance this year may have been healthy, but our relative performance has been humbling and a reminder that the short-term is extremely random. But we continue to believe that this time isn’t different — that the fundamental analysis tools and metrics we use to position our strategies will continue to be reliable predictors of performance over long periods of time (e.g. 10-15 years). In the 11th year of this bull market, we believe it is especially prudent to control downside risk. We continue to underweight what we consider to be the most overvalued segments of the market, the segments that have the most to lose when valuations eventually become relevant again.
Front and center among our valuation concerns is the US stock market. From its 2009 Great Recession lows, the S&P 500 (a good proxy for the US stock market) generated an impressive 442% total return. That’s a big number that can be hard to get your head around, so let me do the math for you. If you put $100,000 into a low cost S&P 500 fund in your retirement account a little over 10 years ago (9MAR09 to be exact), and reinvested its dividends back into the fund, your investment would now be worth a cool $542,000 exiting Q3.
Source: Yardeni.com, AlphaGlider

Source: Bridgewater Associates
The chart above shows the value of the S&P 500 as a percent of revenue (red line) and as a percent of US GDP (blue line). Both are extreme levels today, well above the levels they reached before the S&P 500’s 50%+ fall during the Great Recession, and on par with their levels before the S&P 500’s nearly 50% fall from the peak of the dotcom bubble. Of course there is justification for these two valuation metrics to be higher today than in the past, and to be higher than that of foreign markets — the significant increase in US company profit margins. The chart on the upper right shows that after-tax profit margins of non-financial US companies fluctuated around 4.5% throughout the 1970s, 1980s, and 1990s, but then progressively ramped to nearly 8% today. If you’re going to nearly double your profit per dollar of revenue, then of course it makes sense you should be willing to pay more for that dollar of revenue. But how much more is the question.
During the last 30 years of the 20th century, when US corporates made around 4.5 cents of profit for each dollar of revenue, S&P 500 investors were willing to pay around 75 cents for each dollar of revenue. Today, these investors are paying $2.05 for each dollar of revenue (~175% more than during the 1970-2000 period) which now generates nearly 8 cents of profit (~75% more than during the 1970-2000 period). This tells us that these investors expect US corporate profit margins to continue expanding from today’s record levels. We’ve spent a lot of time trying to understand the reasons why these margins expanded so significantly over the last 20 years and where they may be going in the future. We’ve concluded that US corporate profit margins may be nearing their peak and could be at serious risk of reverting back towards their long-term mean, in which case current S&P 500 valuations are unjustifiably high.
There are only so many major levers that affect profit margins, and nearly all of them benefited US corporates over the last two decades. However looking forward, we see most of these margin tailwinds switching to become headwinds. Below is a listing of what happened to those levers and, in italics, what may happen to them going forward knowing what we know now:
Labor costs: Globalization, spurred by technology and trade agreements, allowed US corporates to aggressively move manufacturing overseas, directly lowering unit labor costs while also putting downward wage pressure on their remaining US workforce. Union membership fell sharply, as did union negotiating power. Historically low unemployment rates, more protective trade policies, and imposition of import tariff s appears likely to reverse all of these trends, driving up US corporate labor costs. Also, the gap between US and emerging market blue collar wages is less extreme than it was 20-30 years ago. Are the United Auto Workers/General Motors and Chicago teachers strike a sign of power shifting back to employees?
Interest expense: US corporate interest rates went from the high teens/low 20 percents in the early 1980s to low single digits percents today. The interest expense line used to a be major drag for S&P 500 companies, but that is no longer this case in today’s low interest rate environment. Although there are no obvious reasons why corporate borrowing rates will increase going forward, it’s clear that they don’t have much room to fall from today’s low levels. This may be a case where the tailwind turns into a stalled wind.

Tax expense: Lower statutory rates, more tax deductions for investments, and tax arbitrage of the international tax system enabled US corporates to lower their effective tax rate from above 40% in the 1970s to less than 20% after the Trump corporate tax cuts. Despite a strong economy and historically low unemployment, the federal budget defi cit is large and growing as a percentage of GDP (deficit was 3.3% of GDP in 2016; the Congressional Budget Office forecasts a 4.5% of GDP deficit this year, trending to 5.0% over the next 10 years). There will be growing pressure to raise tax rates on corporates regardless of which party controls the White House and Congress. All Democratic presidential candidates have said they will roll back Trump’s tax cuts.
Business concentration/government oversight: The US marketplace has gradually grown more concentrated over the four decades (i.e. less competitive). Merger and acquisition activity has been high for the last 25 years (~8% of GDP vs ~3% during the 1970s and 1980s) during a time that government reviews of mergers and unfair competition has fallen dramatically.

Market share in most sectors of the economy are controlled by fewer, but larger and older corporates, giving them more pricing power with their customers and negotiating power with their employees. The Trump administration is aggressively deregulating businesses, particularly on the environmental front. Until recently, Europe has been much more aggressive in regulating and fining large US tech firms, but now Congress, and federal and state agencies are joining the act. Amazon, Apple, Facebook, and Google are all now subject to numerous antitrust investigations. The tech sector in general, and these companies in particular, have been the primary drivers behind the S&P 500’s outsized gains over the last decade, but they are now in the crosshairs of politicians from both sides of the aisle. There has also been bipartisan support behind large government fines against the pharmaceutical companies complicit in the country’s opioid epidemic and regulation of the sales of vaping products. On the environmental front, we expect corporate regulatory costs (including taxes) to increase to address the climate change crisis over the coming years and decades.
Revenue mix and leverage: Globalization has not only lowered labor costs, but also opened up new markets for US corporates to sell into. These new incremental sales came with higher marginal profits as the US corporates’ fixed costs were leveraged. Globalization, in coordination with technology, has also led to more “winner takes all” product segments (e.g. Amazon, Apple, Facebook, and Google) that resulted in extremely high marginal profit margins. Trump is currently reversing globalization, and its benefits, by killing or diluting free trade agreements [e.g. pulling out of the Trans-Pacific Partnership (TPP), pulling out of free trade negotiations with the EU, threatening to pull out of the North American Free Trade Agreement (NAFTA)], and by applying tariff s on imports from the America’s largest trading partners. The more extreme politicians in both parties (Trump on the right, Warren & Sanders on the left) appear likely to continue rolling back globalization.
US corporates benefitted from an extremely friendly environment over the last couple of decades, helping boost profit margins by nearly 75%. However they may have overplayed their hand, triggering a backlash from the ecosystem in which they operate. The CEOs of most of America’s largest companies seemed to have acknowledged this in August when 181 of them signed a new “statement of purpose” for their organizations. Through the Business Roundtable, a US corporate advocacy group, these CEOs declared that their companies no longer exist primarily to serve their shareholders. Instead, they committed to lead their companies “for the benefit of all stakeholders — customers, employees, suppliers, communities and shareholders”. It would appear US firms are at the apex of their profit margin cycle.
Investors like to extrapolate past trends into their forecasts, and it appears that are doing so again in regards to US corporate profit margin expansion by paying 2.05x revenues and 1.9x GDP for the S&P 500. Call us skeptical, call us contrarian — but we’re less optimistic that US corporates’ all-time-high profit margins can be sustained over the long term, let alone expand from here. We would rather underweight this market in favor of other regions where margins are merely running near their long-term averages and their companies are selling at valuations closer to their long-term averages.
If you’ve read this far into my quarterly, you are likely one of those people who believe that keeping one’s costs low is an important element in generating strong risk- adjusted investment returns over the long-term. So you’ll be happy to hear that the major low-cost custodians, including TD Ameritrade Institutional (TDAI), recently did away with trading commissions for stocks and exchange-traded funds (ETFs). Most of the ETFs in our strategies already traded commission-free, so the benefit to you, our clients, will be relatively modest — we estimate that new clients will save around $75 in their first year and existing clients will save around $35 annually from this change.
The abolishment of stock and ETF trading commissions will pressure the revenue lines of the low-cost custodians. Without a doubt, these custodians will push hard in other areas to make up for the lost revenue. We anticipate they will keep interest rates lower for longer on cash balances (which they loan to borrowers at a higher rate), and more aggressively pursue “payment for order flow” arrangements (ultimately related to bid-ask spreads of ETFs we trade). AlphaGlider clients should be relatively insulated from these costs as we run our strategies with low levels of cash, and our long investment horizon results in infrequent trading. We also anticipate that these custodians will attempt to grow their in-house advisory services which allow them to direct flow into own funds and to run high cash levels.