

Bears Ears National Monument, PHOTO CREDIT: US Bureau of Land Management
View a downloadable version of this blog entry »
INVESTMENT ENVIRONMENT1

Source: Orion Advisor Services
The first quarter of 2017 saw global equity markets maintain their strong upward momentum from late 2016. Emerging markets led the way with a double-digit increase, while develop foreign markets slightly outpaced a still strong 6.1% showing from the US market. Fixed income markets were also in positive territory.
The US economy continued its slow but steady progression during the quarter. Q1 earnings for the S&P 500 are forecasted to notch a high single-digit increase, albeit on an easy -6.7% comparable from the year before, a time when falling energy prices gutted energy company earnings. The US jobs market posted its 78th consecutive month of net growth in March, pushing the unemployment rate down to a post-recession low of 4.5%. The next longest period of US job growth was the 48 months that ended June 1990. On the negative side, retail sales, consumer prices, auto sales, consumer and corporate credit growth, and corporate capital spending measures were weaker than expected.
The chart below helps explain the strength in the US equity market since the US presidential election, despite muted economic performance (i.e. “hard” data). “Soft,” forward-looking data, such as consumer confidence and small business optimism, have been extremely strong since the election.

Source: Bloomberg, Morgan Stanley
With the S&P 500 up over 10% since the election, investors as a group are assigning a high probability to accelerating corporate earnings on the back of lower personal and business taxes, reduced regulation, and higher infrastructure spending. However the Trump administration and House Republicans failed in their first major attempt to reduce taxes, the repeal of Obamacare and replace with Trumpcare. The nonpartisan Congressional Budget Office (CBO) determined that Trumpcare would have reduced spending on health care by approximately $1.2 trillion over the next 10 years, mainly through cuts in Medicaid and insurance subsidies to low income Americans. And this is where the health care bill becomes a tax bill — $0.9 trillion of the $1.2 trillion cut in health care spending would be allocated to tax cuts for high earners, drug makers, and health insurers, and the remaining $0.3 trillion would become budget surplus. This surplus could then be used to lower tax rates for businesses in the actual tax reform effort later in the year. Ultimately, the plan failed to garner enough Republican support in the House, with its right wing (the Freedom Caucus) demanding even more cost cutting, and its more moderate wing (the Tuesday Group) concerned about the estimated 24 million Americans who would lose insurance coverage over the next 10 years.
The failure to pass Trumpcare foreshadows future problems for Trump and the GOP in their ambitious attempt to reduce business tax rates to the magnitude investors have priced into the market. First, they lost $0.3 trillion with which to lower rates. Second, the failure exposed deep philosophical divisions within the GOP. The range of conflicting vested interests among various members of the GOP would appear to be more numerous on the topic of tax reform than with health care. At this moment, there appears to be no consensus between Trump and the GOP as to the source of new tax revenue, or spending reductions, to enable significant corporate tax rate reductions. The sources floated/leaked to date, a border adjustment tax, a value-added tax, and a carbon tax, have all generated significant resistance by large factions within the Republican establishment. Treasury Secretary Steve Mnuchin recently indicated that his August deadline for passage of a tax bill is unlikely to be met. Although Trump’s yet to be introduced $1 trillion, 10-year infrastructure program may be easier to pass, delays in health care and tax bills are pushing out its legislative review.
One area that Trump’s agenda may be executed as planned and on schedule is his vow to lighten regulation, or stop enforcing regulations on business, especially natural resource extraction, power generation, telecommunications, and financials. The US commitment to the Paris Climate Agreement appears to be all but dead as Trump takes aim, via executive order, at the Obama-era Clean Power Plan and the car/truck fuel-economy standards. Coal mining companies and utilities with coal-fired power plants will benefit from the dismantling of the Clean Power Plan, as well as Trump’s order to reopen federal lands to mining of coal. Telecommunication providers will benefit from a lighter regulatory touch, most immediately by the green light given to them to sell consumers’ web browsing and app storage histories. In the financial sector, Trump has begun the process to roll back key parts of Dodd-Frank, a law enacted after the financial crisis of 2007/08 to improve stability of the US financial system.
Trump also delayed the April start of the Department of Labor’s Fiduciary Rule, the beginning of the process to defang a set of regulations that would require broker-dealers to act in the best interest of their clients when working with their retirement accounts (but not their taxable, non-retirement accounts). You should be glad to know that AlphaGlider is not a broker-dealer, but rather a Registered Investment Adviser (RIA). Unlike broker-dealers, RIAs have a fiduciary responsibility to all of their clients, regardless of type of investment accounts they have. As a fiduciary, RIAs are required to always act impartially and provide advice that is in their clients’ best interest before their own profit, with care, skill, and diligence that a prudent professional would be expected to give.
There are many Trump campaign promises that have not been acted upon which have been positive for the markets and the US economy. Campaign promises with direct economic consequences include labeling China a currency manipulator on day one of his presidency, dissolving the Export-Import Bank, immediately and aggressively renegotiating or exiting the North American Free Trade Agreement (NAFTA), and removing Janet Yellen as chairperson of the Federal Reserve (Fed) when her term expires in February 2018. Trump has also backed off on some foreign policy pledges that would have had a destabilizing effect on global geopolitics, and in turn global stock markets, such as dropping US’s commitment to the North Atlantic Treaty Organization (NATO), breaking the Iran nuclear deal, resuming torture interrogation techniques, moving the US embassy in Israel to Jerusalem, and attempting to forcibly expel China from the islands it built and currently occupies in the South China Sea.

On the fixed income front, the Fed raised its benchmark for the second time in three months, to a range between 0.75% and 1.0%. With unemployment now well below 5% and inflation creeping up to the Fed’s 2% target, one would expect that the Fed will continue to slowly raise rates so long as this remains the case.
International developed markets continue top suffer from slow economic growth and low inflation, thus investors generally expect their respective central banks to remain on hold with their historic low rates for years to come.
On geopolitics, risks increased during the quarter for investors. Although Trump campaigned on an “America first” approach that prioritizes domestic issues while sounding isolationist in regards to foreign relations, he has acted quite hawkish once in office. One example of this is in Syria where Trump had advocated a strategy of working with Russia and the al-Assad regime to fight Islamic State (ISIS) during his campaign, but in office he launched a missile strike against a Syrian air base and called for al-Assad’s overthrow after his heinous chemical attack against civilians. Trump’s pledge to reboot relations with Russia now appears to be dead in the water. Another example of sharply escalating tensions comes from Asia where North Korea has accelerated its missile tests and has threatened to conduct another nuclear test, while Trump has responded by threatening military action and dispatched a US Navy strike group to its shores. Trump has also threatened the trading relationship between the US and China if the latter does not help with the North Korea “problem.”
In the Netherlands, the first of three important 2017 European federal elections saw the defeat of a populist, far-right candidate. Next up is France which holds the first round of its presidential election on April 23, followed by the September 24 federal election in Germany. These latter two elections also include populist, far-right candidates who, if elected, would push their respective countries out of the euro and the European Union (EU).
As anticipated, the United Kingdom (UK) triggered negotiations to exit the EU in late March. All signs indicate that the UK will pursue a “hard” exit that will likely leave it with little to no preferential access to the markets of the EU, and visa versa. Although the UK remains in the EU during what is expected to be two years of talks, businesses and individuals have already begun preparing for the higher level of restrictions on the free movement of goods and people between the UK and what remains of the EU.
Europe continues to struggle with two other major economic crises, one in Greece and one in Italy. The Greek government does not appear to have the funds to pay its upcoming July debt payment, and thus is negotiating with its lenders and the International Monetary Fund (IMF) for more loans and debt relief. In Italy, there is a large number of banks saddled with non-performing loans that threaten to destabilize the European banking system.
PERFORMANCE DISCUSSION
Given the strong performance of global equity markets and our overall defensive positioning, it was not surprising that our AlphaGlider strategies lagged their benchmarks. Official numbers are not in yet, but it looks like our strategies captured about 75-80% of the benchmarks’ upside during the quarter.
The main drag to our relative performance during the period was from our underweight equity position — our equity benchmark, the MSCI ACWI IMI, was up 6.8% during the quarter. However, the drag in performance was mitigated somewhat to our heavy exposure to international stocks, particularly stocks in emerging markets. Our emerging markets fund,2 Vanguard FTSE Emerging Markets (VWO), was up 11.2% in the quarter. Another source of underperformance for our strategies was our relatively high level of cash, and our cash-like fund, Vanguard Market Neutral (VMNFX),3 which was down -2.4% in the quarter.
Within our US equity positioning, our value-oriented funds, Vanguard Value (VTV) and Vanguard High Dividend Yield (VYM), lagged the S&P 500, up “only” 3.1% and 3.2%, respectively. However, our investments in sectors considered disadvantaged by Trump’s economic policies performed well — Vanguard Health Care, VHT and Vanguard Information Technology, VGT were up 11.2% and 11.9%, respectively.
Financials, and energy, and small cap US stocks, all viewed as major beneficiaries of Trump tax, trade, and regulatory policies and had been strong performers in 4Q16, were relative underperformers in 1Q17, +2.1%, -7.0%, +3.7%, respectively. AlphaGlider strategies were underweight all of these sectors during the quarter.
OUTLOOK & STRATEGY POSITIONING
Our basic view of the markets has not changed in the new year. We think the US equity market continues to offer a poor risk-reward tradeoff, one that is even worse now than three months ago given its 6% rise in value, the unexpected troubles Trump has had in executing his pro-business agenda of tax cuts and infrastructure spending, and rising tensions for the US in the Middle East and the Korean peninsula. The S&P 500 is now up over 300% on its 2009 lows, well in excess of its expansion in earnings.
If you are a frequent reader of mine, you will be familiar with the importance of cyclically adjusted price-to-earnings (CAPE) and price to sales ratios in our long-term portfolio construction process. These ratios are currently running at worryingly high levels for the S&P 500, predicting a high probability of poor long-term (5-15 year) real returns going forward. Over the next couple of pages I will introduce another valuation metric that has historically done a good job of predicting long-term returns: the ratio of non-financial market capitalization to non-financial gross value-added (GVA). GVA is similar to gross domestic product (GDP) , but also includes the value of foreign revenue generated by domestic companies.
As you can see in the chart on the following page, the metric has been a strong predictor of subsequent long-term returns (12 years in this case) for the S&P 500. At a current market cap to GVA ratio of approximately 2.0, today’s valuation has only been exceeded one other time since 1950, in 1999/2000 at the peak of the dotcom bubble. Today’s ratio is estimating a mean expected return of only 0.6% annually (nominal) over the next 12 years.

Source: Hussman Strategic Advisors
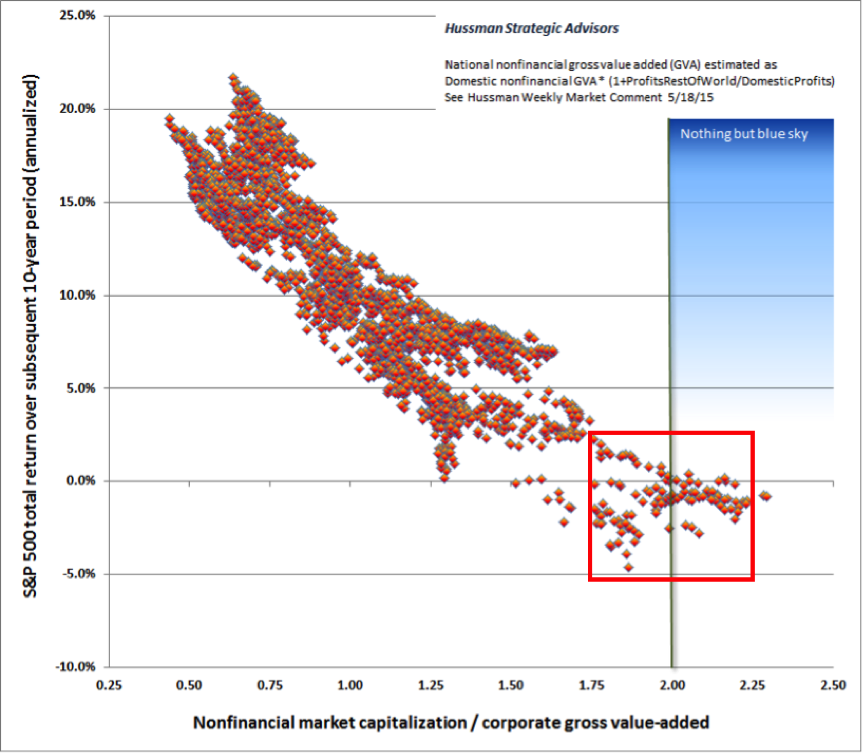
Here’s another way to look at the historical record of the S&P 500’s market cap to GVA ratio, this time plotting subsequent 10-year annualized nominal returns against the ratio. If we look in the 1.75x to 2.25x range that we currently sit within today, you can see that the very best subsequent 10-year annualized nominal return was a relative mediocre 2.5%. The majority of returns were negative. Note that Hussman, the firm behind the chart, was being sarcastic in describing today’s 2.0x valuation as “Nothing but blue sky.”
Source: Hussman Strategic Advisors
Critics of this valuation metric, and of the CAPE and price-to-sales ratios, frequently point to their relative inability to predict short-term returns, and that is true. Short-term returns, such as over a one year period, are fairly random. But as far as I know, there are no valuation metric or technique that can reliably predict short-term returns. That said, the historical range of short-term returns at today’s 2.0x ratio have not been good. As shown below, there have been no positive 18-month annualized nominal returns above a ratio of 1.85x.

Source: Hussman Strategic Advisors
While we find the US equity market to be overpriced, we are still able to find bargains in some overseas equity markets. As noted before, emerging markets still provides good value with a CAPE of approximately 15x (the CAPE for the S&P 500 is 28x). Value can also be found in select developed markets. For example this quarter we initiated a new position in a Singapore equity index fund, iShares MSCI Singapore Capped ETF (EWS), which has a CAPE of only 12.5x. Besides valuation, which we graphically display five metrics for below relative to the S&P 500, we are attracted to Singapore for its strong and transparent governance, political neutrality, its legal system based on English common law, low taxes, proximity to large and growing emerging markets (notably China, India, and Indonesia), stable currency, large proportion of value added industries, and overall strong management teams.

Source: AlphaGlider, Morningstar

Finally, we would like to bring your attention to a new and exciting initiative that AlphaGlider began early this year — becoming one of the newest corporate members of 1% for the Planet. We feel strongly about the environment and how important it is for the long-term value of everything we most cherish in this world, from our health, to our quality of life, to our wealth. From this year forward AlphaGlider will donate 1% of its revenue to one or more environmental nonprofits that participate in the 1% for the Planet ecosystem.